
Abstract
Short-rotation crop (SRC) systems with woody species have been planted in Costa Rica. However, information about different tree species and spacing is limited. The objective of the present study was to examine biomass production and the physical, energy, and chemical properties of feedstock of four tropical tree species (Cordia alliodora, Dipteryx panamensis, Gmelina arborea, and Tectona grandis) in 34-month-old plants planted at four spacings (0.5×1.0 m, 1.0×1.0 m, 1.0×2.0 m, and 2.0×2.0 m). The highest mortality rate (50%) was found in G. arborea; however, diameter, height, basal area, and biomass production in G. arborea plantations were higher than T. grandis, C. alliodora, and D. panamensis. Spacing effects on diameter, height, basal area, and biomass production were observed in 10-month-olds. Wide spacing presented the highest values in diameter and height, but the highest biomass production was found in the narrow spacing. Also, biomass distribution was different in D. panamensis in relation to other species. Specify gravity, density, and moisture content of biomass showed high variation between species and spacing, but the energy and chemical properties of biomass showed few differences. These results suggest that these four species were uniform in terms of their energy and chemical properties, regardless of the spacing used. Finally, three species (G. arborea, C. alliodora, and T. grandis) presented important potential for use in SRC systems. G. arborea was the species with the highest production but a high mortality rate.
Download PDF
Full Article
Energy Production and its Characteristics from Four Tropical Trees Species Planted in Short Rotation Woody Systems in Costa Rica
Carolina Tenorio,a Roger Moya,b,* Olman Murillo,c and Jonathan Loría d
Short-rotation crop (SRC) systems with woody species have been planted in Costa Rica. However, information about different tree species and spacing is limited. The objective of the present study was to examine biomass production and the physical, energy, and chemical properties of feedstock of four tropical tree species (Cordia alliodora, Dipteryx panamensis, Gmelina arborea, and Tectona grandis) in 34-month-old plants planted at four spacings (0.5×1.0 m, 1.0×1.0 m, 1.0×2.0 m, and 2.0×2.0 m). The highest mortality rate (50%) was found in G. arborea; however, diameter, height, basal area, and biomass production in G. arborea plantations were higher than T. grandis, C. alliodora, and D. panamensis. Spacing effects on diameter, height, basal area, and biomass production were observed in 10-month-olds. Wide spacing presented the highest values in diameter and height, but the highest biomass production was found in the narrow spacing. Also, biomass distribution was different in D. panamensis in relation to other species. Specify gravity, density, and moisture content of biomass showed high variation between species and spacing, but the energy and chemical properties of biomass showed few differences. These results suggest that these four species were uniform in terms of their energy and chemical properties, regardless of the spacing used. Finally, three species (G. arborea, C. alliodora, and T. grandis) presented important potential for use in SRC systems. G. arborea was the species with the highest production but a high mortality rate.
DOI: 10.15376/biores.19.1.695-715
Keywords: Bioenergy; Energy potential; Firewood; Spacing; SCR; Tropical species
Contact information: a: Instituto Tecnológico de Costa Rica, Escuela de Ingeniería Forestal, P.O. Box: 159-7050 Cartago-Costa Rica. e-mail: ctenorio@itcr.ac.cr; (C.T.) ORCID: 0000-0003-2901-7079; b: Instituto Tecnológico de Costa Rica, Escuela de Ingeniería Forestal, P.O. Box: 159-7050 Cartago-Costa Rica. (R.M.) ORCID: 0000-0002-6201-8383; c: Instituto Tecnológico de Costa Rica, Escuela de Ingeniería Forestal, P.O. Box: 159-7050, Cartago-Costa Rica. e-mail: omurillo@itcr.ac.cr, (O.M.) ORCID: 0000-0003-3213-8867; d: Instituto Tecnológico de Costa Rica, Escuela de Ingeniería Forestal, Email: jonathanlm.cr@gmail.com, P.O. Box: 159-7050 Cartago-Costa Rica. (J.L.); *Corresponding author: rmoya@itcr.ac.cr
GRAPHICAL ABSTRACT

INTRODUCTION
Biomass is one of the main renewable energy resources due to its great potential, economic viability, renewability, and various social and environmental benefits (Amjith and Bavanish 2022). The energy obtained from biomass is called primary energy, which means that the energy comes from perennial plants (arboreal or not) and is used to produce biomass for energy (Giudicianni et al. 2021). Trees produced in short rotation crops (SRC) are an important potential source of biomass, which can be used as solid fuel with different shapes (firewood, wood chips, pellet) or processes, including thermic or thermo-chemical (torrefaction, charcoal, gasification, liquation) (Rodrigues et al. 2021). SRC are a silvicultural system based on short rotation, less than 1 to 15 years (Eisenbies et al. 2021). Genetically superior trees and intensive management such as fertilisation, irrigation, and weed control are implemented in these systems (Johnston et al. 2022).
Woody species planted under SRC systems have been established in many countries around the world, especially in the European Union and North America (Djomo et al. 2015; Ile et al. 2022). However, limited experience in establishing SRC is found in the Latin America area (Moya et al. 2019; Silva et al. 2022); little by little, they have gained importance in countries including Chile (Yáñez et al. 2019), Brazil (Santos and Reichert 2022), and some Central American countries such as Costa Rica (Tenorio et al. 2019a,b). There are different species that can be used in SRC systems (Dickmann 2006). In temperate climates, there are Populus, Salix, Pinus, Robinia, and Eucalyptus in the EU region (Amichev et al. 2014; Djomo et al. 2015; Pleguezuelo et al. 2015), and in Latin America, a great diversity of species in the SRC, between 35 and 40 species (Moya et al. 2019), probably due to the great adaptability of the species to different soil conditions (Rockwood et al. 2019).
Costa Rica, a small country in Central America, developed its energy matrix around renewable sources (Hernández-Chaverri and Buenrostro-Figueroa 2021). Biomass represents 14% of the different energy sources (Popp et al. 2021), and a high percentage of this biomass comes from agricultural waste (Alonso et al. 2017). However, a characteristic of biomass from agricultural waste is that it presents a high moisture content, and in addition, its collection system is expensive (Abuelnuor et al. 2014). While forest biomass has a significant volume (Valverde et al. 2021) and potential as a renewable energy source, its use is limited (Moya et al. 2019), even though woody feedstock is more efficient at conversion to energy than many agricultural residues (Alonso et al. 2017).
Woody biomass currently comes from many sources in Costa Rica, among them residues in the plantation during logging, residues in primary sawmills, and short rotation (SRC) plantation systems (Valverde et al. 2021). The research and knowledge of species used in SRC are recent, and few species have been tested and planted (Moya et al. 2019). Notable species include Gmelina arborea (Salazar-Zeledón 2016; Tenorio et al. 2016, 2018; 2019a; Tenorio et al. 2019b), Eucalyptus saligna and Eucalyptus camaldulensis (Navarro-Camacho et al. 2014), and Eucalyptus tereticornis (Valverde et al. 2022).
For G. arborea in SCR, Tenorio et al. (2016 and 2018) reported that, during the first two years, 0.5×1.0 m and 1.0×1.0 m spacing presented higher growth in diameter and height and biomass production than 2.0×1.0 m spacing. In addition, these authors point out that the site is the main factor in the production of biomass and that the energy characteristics of the trees growing in SRC vary widely from one year to another. In another study carried out on G. arborea in SRC at 24 months of age with three spacings (1.0×1.0 m, 0.75×0.75 m, and 1.0×0.5 m) but using two clones used for wood production, the effect of the clone was found in the mortality, the morphological characteristics of the trees, the leaf area, the biomass production, and a few variations in energy biomass characteristics (Tenorio et al. 2019b).
In other species tested in SRC, such as Dipteryx panamensis, the chemical, physical, and energy properties of the biomass were evaluated at three different spacings (1.0×2.0 m, 1.0×0.5 m, and 1.0×1.0 m) at the age of 3 years (Gaitan-Alvarez et al. 2020). Increasing the spacing increased the plant’s green density and moisture content, and 1.0×1.0 m and 1.0×0.5 m spacings were found to produce the highest biomass (Gaitan-Alvarez et al. 2020). The other two species, Tectona grandis and Cordia alliodora have been used in fast-growing plantations for commercial reforestation in Costa Rica for sawlog production (Moya et al. 2019); therefore, information on the processes and properties of these species is abundant and known (Moya et al. 2019). However, the use of these species in the SRC system lacks information about biomass production and its energy properties (Shukla and Viswanath 2021).
The objective of this study was to determine the growth (mortality, diameter, height, and basal area), biomass production, and physical, energy, and chemical properties of four forest trees species (C. alliodora, D. panamensis, G. arborea, and T. grandis) planted under SRC at the age of 36 months, using four planting spacings (0.5×1.0 m, 1.0×1.0 m, 1.0×2.0 m, and 2.0×2.0 m). Knowledge of the information just mentioned will allow determination of the energy potential and biomass production of four different species according to spacing and establish the species with best volume productions and best energy characteristics.
EXPERIMENTAL
Geographic Location and Plantation Description
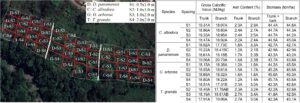
Four different plots of SCR system with Cordia alliodora, Dipteryx panamensis, Gmelina arborea, and Tectona grandis were planted in Florencia (Fig. 1a), San Carlos, Alajuela, Costa Rica (N 10 21´ 29.7,” W 84 28´ 3.4”). The site where plots were planted was divided into three blocks. The site presented a slight slope in a west-to-east direction, so the site was separated into three blocks. For each of the species, four different spacings with three plots were established: 0.5×1.0 m equivalent to 20000 N/ha (S1), 1.0×1.0 m, equivalent to 10000 N/ha (S2), 1.0×2.0 m, equivalent to 5000 N/ha (S3), and 2.0×2.0 m, equivalent to 2500 N/ha (S4). A plot was established in each block and 64 trees were planted (8 trees in width and 8 trees in length). A total of 12 plots were randomly established (Fig. 1b) per species (4 spacings x 3 plots = 12 experimental units).

Fig. 1. Geographic location of SCR system in Costa Rica (a) and distribution of plot for each species in different spacing (b)
Determination of Mortality, Diameter, Height, and Basal Area
A plot was established in the center of every experimental unit, considering 36 trees (6×6 trees), and the trees with 2 external rows and 2 external columns of repetitions were not considered. The diameter and height were measured on 36 trees. A 30 cm diameter was measured from the basal part of the tree. These two parameters and mortality were determined at the ages of 6, 12, 19, 22, 29, and 34 months. The irregularity in the measurement age is attributed to the pandemic period between 2020 and 2021. The percentage of mortality and the basal area of each plot per species were determined. The mortality rate was determined based on the percentage relationship between the number of individuals within each plot and the total number of trees (36 trees) within the plot. The basal area of each plot was calculated using Eq. 1. The average value of the spacing was calculated and extrapolated to the hectare level. Then parameters determined (mortality, diameter, height, and basal area) will make it possible to know the behavior of the species in the trials, and in addition, to know the growing of the best species in the different spacing conditions.
 (1)
(1)
Tree Sampling and Sampling in the Tree
Biomass sampling was conducted at 34 months of age. Three trees were sampled in each plot, and then 144 trees per species were sampled (4 species x 4 spacings x 3 plots x 3 trees = 144 trees). Before cutting the sample tree, the diameter of 30 cm from the basal part of the tree was measured. After being cut at ground level, branches and leaves were separated from the trunk. Each part (leaves, branches, and trunks) was weighed separately. Then, six 10-cm-long cross sections were extracted from three different heights: two samples from the base of the tree, two samples at total height, and two samples at 50% total height. One sample from each height was used for specific gravity and green density determination, and the other sample was used for the determination of the moisture content of the trunk and bark. All this material was packed in plastic bags to keep it dry. The remaining trunk material was ground to obtain chips not greater than 3 mm long.
Biomass Determination and Energy Production
The biomass of the total trunk was estimated using the moisture content of the trunk (MCtrunk) and its weight in green condition (Eq. 2). The weight of all the leaves and branches after drying was used to determine the biomass for these parts of the tree. The calculated biomass of the trunk (biomasstrunk), leaves (biomassleaves), and branches (biomassbranch) were used to calculate the percentage distribution of biomass for each of these parts of the tree. In addition, the biomass values obtained were projected to estimate biomass per hectare for each type of plantation spacing,
 (2)
(2)
where the biomass can be the biomass of trunk, biomass of bark, biomass of branch, or biomass of leaves.
Determination of the Moisture Content, Specific Gravity, and Green Density
To calculate the moisture content (MC), leaves (MCleave) and branches (MCbranch) in green condition were weighed and then placed in an oven at 103 °C for 24 h and reweighed after that period. The MC was calculated using the weight percent ratio of weight after drying and weight before drying (MC= (weight before drying-weight after drying)/weight after drying x 100). Meanwhile, to calculate the MC of the bark (MCbark) and the trunk (MCtrunk), the 10 cm samples obtained at three different heights were used after removing the bark from the trunk. Both parts were oven-dried at 103 °C for 24 h. The weight before and after drying was measured and used to find the MC with the percent ratio as described above. The specific gravity (SG) was only determined for the trunk, using the trunk cross-section comprising the xylem and the bark. ASTM D-143 (2022) was used to determine the volume of this cross-section based on its weight and water displacement. Then, the cross-section was placed in the oven for 24 h at 103 °C according ASTM D-143 standard (2022). The SG was determined according to the ASTM D-4442 (2020). In the same manner, the trunk density was determined based on the green weight/green volume ratio.
Determination of the Chemical and Energy Characteristics
The chipped material from the trunks (wood and bark) of the three trees in each experimental unit was combined into one sample. This sample was air-dried to 12% MC. Following this, the material was sieved through 0.25 mm and 0.42 mm meshes (40 and 60 meshes, respectively). The same procedure was used with the branches of the three trees sampled. As for the chemical characteristics, the percentage of carbon (C), nitrogen (N), hydrogen (H), carbon-nitrogen ratio (C/N), and carbon-hydrogen ratio (C/H) was determined with the Elemental Analyzer, Vario Macro Cube model. Then C, N, H, C/N, and C/H content was measured for trunk and branch and named Ctrunk, Cbranch, Htrunk, Hbranch, C/Htrunk, and C/Hbranch.
Regarding the energy characteristics, the gross calorific value (GCV) and ash content of the trunk and branch were determined: GCV in the trunk and branch (GCVtrunk and GCVbranch), and ash content in the trunk and branch (Ashtrunk and Ashbranch). In order to determine GCV, a portion (approximately 10 grams) of the sieved material from the trunk (wood and bark) and the branches was dried at 103 °C for 24 h. To find GCV, Parr’s calorific test was used according to the ASTM D-5865 (2019), using five samples weighing 2 g each. As for the ash content, 10 g of the sieved material of each experimental unit (trunk and branches) was used, and the procedure followed ASTM D-1102 (2021).
Again, all characteristics of biomass (production, moisture content, specific gravity and green density, and chemical and energy properties) make it possible to determine which species and different spacing conditions with better energy properties.
Data and Statistical Analysis
Compliance of the variables measured with the assumptions of a normal distribution and homogeneity of the variances, as well as the presence of outliers, were verified. A variance analysis was applied to verify the effect of spacing on each species. Spacing was the independent variable of the model and the variables measured (SG, density, carbon and hydrogen percentage and its ratio, GCV, ash content, and biomass) were the response variables. The Tukey test was used to determine statistical differences between the averages of the variables measured. The variance analysis and the Tukey tests were conducted using SAS software (SAS Institute Inc., Cary, NC).
RESULTS AND DISCUSSION
Mortality and Growth in Diameter and Height
According to Fig. 2, mortality rates are presented based on species and spacing. The S2 spacing presented the highest mortality percentage of all species. C. alliodora had a mortality of around 40% for S2 spacing at 34 months, which is attributed to the loss of a plot after the establishment of the plantation (Fig. 2a). Mortality rates of 22% and 15%, respectively, were observed at S1 and S4 spacings (Fig. 2a). The S3 spacing presented a low mortality rate, less than 8% (Fig. 2a). In D. panamensis, the S2 spacing presented a mortality of 28% at 34 months, followed by the S1, S3, and S4 spacings (Fig. 2b). G. arborea presented the highest mortality in all spacings tested (Fig. 2c). The S2, S3, and S4 spacings showed the lowest values before 12 months; however, an increase in mortality was observed up to 34 months (Fig. 2c). The S1 spacing presented values higher than 15% from the sixth month, up to 44% at 34 months (Fig. 2c). Finally, T. grandis presented the highest mortality (34%) at 34 months at S1 and S2 spacings, followed by S4 and S3 spacings (Fig. 2d).

Fig. 2. Mortality by age and spacing of four tropical species grown in a short rotation system: (a) C. alliodora, (b) D. panamensis, (c) G. arborea, and (d) T. grandis.
The trees’ height and diameter increased with age (Figs. 3 and 4). The spacing effect on the height and diameter was observed after 10 months; the wider spacing showed the highest values of height and diameter (Figs. 3 and 4). Another aspect to highlight is that the S3 and S4 spacings had the most effective development in height and diameter at the end of 34 months in all the species, and between these two spacings, there was little difference in height but a greater difference in diameter (Figs. 3 and 4).

Fig. 3. Average height by age and spacing of four tropical species grown in a short rotation system: (a) C. alliodora, (b) D. panamensis, (c) G, arborea and (d) T. grandis

Fig. 4. Average diameter by age and spacing of four tropical species grown in a short rotation system: (a) C. alliodora, (b) D. panamensis, (c) G. arborea and (d) T. grandis
In general, G. arborea trees presented the highest values of height and diameter, followed by those of T. grandis, C. alliodora, and D. panamensis (Figs. 3 and 4). G. arborea presented variation across age: between 6 and 12 months, the S1 spacing presented the highest average height, but this spacing presented the lowest average after 12 months in relation to the other spacings (Fig. 3c).
Regarding the basal area, G. arborea presented the highest average in each spacing, followed by C. alliodora, T. grandis, and D. panamensis, except for the S1 spacing of T. grandis, which presented an average basal area greater than C. alliodora (Fig. 5). The basal area decreased with spacing in all species. S4 spacing (narrow spacing) presented the lowest average basal area, while S1 spacing presented the highest average (Fig. 5). For G. arborea, the spacings S4 and S3 presented similar basal areas in different tree ages (Fig. 5c). In T. grandis, during the first 8 months, no differences were observed in the basal area at four spacings (Fig. 5d). In addition, after 34 months of measurement for both G. arborea and T. grandis, in the S2 spacing, the basal area decreased (Figs. 5c and d).

Fig. 5. Average basal area by age and spacing of four tropical species growing in a short rotation system: (a) C. alliodora, (b) D. panamensis, (c) G. arborea, and (d) T. grandis
Biomass Distribution
Table 1 presents the biomass averages for the different parts of the tree. The highest averages of Biomasstrunk and Biomassbranch occurred in G. arborea, followed by C. alliodora, T. grandis, and D. panamensis. Regarding Biomassbark, T. grandis presented the highest average, followed by G. arborea, C. alliodora, and D. panamensis. In Biomassleaves, D. panamensis presented the highest average, followed by T. grandis, C. alliodora, and G. arborea (Table 1). Statistical differences were observed only between spacings in the biomassbark of C. alliodora and D. panamensis. S1 presented the statistically highest value and S4 the lowest for C. alliodora and D. panamensis. S1 presented the statistically highest value, and no differences were observed between S2, S3, or S4 (Table 1). In the case of G. arborea, no differences were observed between spacings for any of the different types of biomasses (Table 1). In the case of T. grandis, no differences were observed in biomasstrunk, biomassbranch, and biomassleaves, the biomassbark, biosmasstrunk+bark, and biomasstrunk+bark+branch had the highest statistical value of S1 spacing, while S4 presented the lowest values of these biomasses (Table 1).
Table 1. Average Biomass at 34 Months per Tree Part and Spacing for Four Tropical Species Growing in a Short Rotation System

Different letters in values of biomass mean statistical differences at 95% in different spacings.
Figure 6 presents the percentage distribution of biomass for the different parts of the tree at 34 months. A different biomass distribution was observed for different types of biomasses for four species, and as expected, the biomasstrunk showed the highest percentage. For C. alliodora, the spacings S1 and S2 presented a similar biomass distribution; the highest percentage corresponded to the biomasstrunk, followed by the biomassbark, biomassbranch and the lowest percentage was for biomassleaves. Among these species, the biomass distribution was different in S3 and S4 spacing; biomasstrunk, accounted for the highest percentage, followed by biomassbranch, biomassbark, and biomassleaves (Fig. 6a). The biomass distribution of D. panamensis was similar in S1, S2, and S3 spacing; the highest percentage was for biomasstrunk, followed by biomassleaves, biomassbark, and the lowest percentage was for biomassbranch. For S4 spacing, the biomass distribution was different; the highest percentage was found in biomasstrunk, followed by biomassleaves, biomassbranch, and biomassbark presented the lowest percentage (Fig. 6b). For G. arborea, the highest percentage was in biomasstrunk at four spacings, followed by biomassbranch, biomassbark, and biomassleaves (Fig. 6c). T. grandis exhibited the highest biomasstrunk, followed by biomassbark, biomassleaves, and biomassbranch at all spacings (Fig. 6d).

Fig. 6. Biomass distribution at 34 months per tree part and spacing for four tropical species grown in a short rotation system: (a) C. alliodora, (b) D. panamensis, (c) G. arborea and (d) T. grandis
Tree Sampling and Sampling in the Tree
Table 2 presents biomass physical properties. The MC of branches presented the highest values, followed by the bark and trunk + bark.
Table 2. Physical Properties of Biomass at 34 Months for Four Tropical Species Growing in a Short Rotation System

Different letters in values of biomass mean statistical differences at 95% in different spacings.
The lowest value was in the trunk for C. alliodora, D. panamensis, and T. grandis, but in G. arborea, the MC of bark was the highest value, followed by similar values for branch, trunk, and trunk + bark. Specific gravity and density varied between species; D. panamensis displayed the highest value, followed by T. grandis, G. arborea, and C. alliodora with the lowest values (Table 2).
Regarding spacing, a greater effect was observed in C. alliodora, D. panamensis, and G. arborea, but a lesser effect was observed in T. grandis (Table 2). In C. alliodora, no statistical differences were observed between the spacings for MCbark, MCtrunk+bark, MCbranch, and density (Table 2). The highest values of MCtrunk are presented in S3 spacing, and the lowest value is in S1 spacing. For SG, S1 spacing presented the highest value, while the S2 spacing had the lowest value (Table 2). In D. panamensis, no differences were observed among spacings for MCbark and MCbranch, while for MCtrunk and MCtrunk+bark, S1 and S2 spacings showed the highest values and S4 spacing was the lowest in MCtrunk, but S3 and S4 spacing presented the lowest in MCtrunk+bark. For SG and density, the largest spacings (S3 and S4) presented the highest values, while S1 presented the lowest values (Table 2). In G. arborea, no differences were observed between the MCtrunk, MCbark, MCtrunk+bark, and MCbranch variables in SG. The S4 spacing presented the highest value of density, and the S2 spacing presented the lowest. No differences were observed between spacings for any of the variables evaluated for T. grandis (Table 2).
Table 3 presents the energy and chemical properties evaluated at 34 months. There were no differences in GCV, C, H, or the ratio C/H between species or between trunk and branch. Some differences were observed in ash content, and this variable ash content in the branches was higher than in the trunks of all species (Table 3).
Table 3. Physical Properties of Biomass at 34 Months for Four Tropical Species Growing in a Short Rotation System

Note: different letters in values of biomass mean statistical differences at 95% in different spacings.
Regarding the different species, C. alliodora presented the highest GCV values, followed by D. panamensis, G. arborea, and T. grandis. For the ash content, T. grandis presented the highest averages, followed by C. alliodora, D. panamensis, and G. arborea (Table 3). For C. alliodora and G. arborea, no differences were observed between spacings for GCVtrunk, GCVbranch, Ashtrunk, and Ashbranch. In D. panamensis, no statistical differences were observed in GCVtrunk and Ashtrunk, while S4 spacing presented the highest value for the GCVbranch and the lowest value was measured in S1 spacing. In relation to Ashbranch, S1 spacing presented the highest value, and no differences were observed between S2, S3, and S4 spacings (Table 3). For T. grandis, statistical differences were only observed for the GCVbranch, where S4 spacing presented the highest value and S1 the lowest. In other variables (GCVtrunk, Ashtrunk, and Ashbranch), no differences were observed (Table 3).
Regarding the chemical properties, G. arborea presented the highest average of C, H, and C/H ratio (trunk and branch), followed by C. alliodora, D. panamensis, and T. grandis (Table 3). For C. alliodora, no statistical differences were observed between the spacings for Ctrunk, Cbranch, Htrunk, Hbranch, and C/Hbranch. According to Table 3, S3 spacing was the highest and S2 spacing was the lowest in this species for C/Htrunk. D. panamensis showed the greatest number of statistical differences between spacings. The spacings S2, S3, and S4 presented the highest values of Cbranch, while the S1 spacing presented the lowest. For Htrunk, S4 spacing presented the highest value and S1 had the lowest value. In Hbranch, S2, S3, and S4 spacing presented the highest values, while S1 spacing presented the lowest value. For C/Htrunk, S1 spacing presented the highest value and S4 the lowest value. For C/Hbranch, S3 and S4 spacing presented the highest values, and S1 spacing presented the lowest values. Finally, Ctrunk did not present differences between the spacings (Table 3). In G. arborea, statistical differences were observed between spacings in Htrunk, where S4 spacing presented the highest value and S1 the lowest values, and in C/Htrunk, S3 spacing presented the highest value and S4 the lowest values; for Ctrunk, Cbranch, Hbranch, and C/Hbranch, no differences were observed between the spacings (Table 3). For T. grandis, differences were observed between spacings in C/Htrunk, where S1 and S2 spacing presented the highest values and S3 and S4 spacing presented the lowest values (Table 3). For the variables Ctrunk, Cbranch, Htrunk, Hbranch, and C/Hbranch, no differences were observed between the spacings (Table 3).
Mortality and Growth
The high percentage of mortality found in C. alliodora in S2 spacing (Fig. 2a) was due to the loss of one plot, which could be the consequence of poor handling of the plant seedlings during the establishment of the plot. This problem was found only in this plot. An increase in mortality was observed after 10 months in the S2 and S3 spacings of G. arborea (Fig. 2c) due to a tree in the natural forest near the boundary of the plantation falling on the plantation, which directly affected the plots of these two spacings, causing from this moment on an increase in tree mortality. However, apart from these events, for the four species, the wide spacings (S4 and S3) had lower mortality than the narrow spacings (S2 and S1). This result suggests that the level of tree competition at narrow spacing causes an increase in their mortality. Several factors contribute to mortality in SRC (Paris et al. 2011): (i) initial implantation of a plantation leads to the tree’s growth until it reaches the maximum resource availability that the site can support (Paris et al. 2011). However, growth is limited once competition among the trees begins and resource release through mortality occurs (DeBell et al. 1996). (ii) The second aspect is the amount of resources in the soil, which conditions tree survival (Laureysens et al. 2004). Competition is greater on sites that lack the necessary resources for tree growth, which leads to the mortality of some individuals (Dillen et al. 2013).
So, the conditions of the soil and the demand for resources at the site where the SRC system was established were probably inadequate for D. panamensis, G. arborea, and T. grandis (Fig. 2b-d), more so given the tree’s need for resources at the spacings applied (Paris et al. 2011). As a result, tree mortality at the various spacings was high, so tree survival was low (Fig. 2c).
In the comparison of mortality of the different species with other studies, it was found that Tenorio et al. (2016; 2018) reported mortality between 23 and 60% at 24 months old for G. arborea in different spacings and 44 to 56% in two clones of this species at 24 months old (Tenorio et al. 2019), which agreed with values found for this species in this study (Fig. 2c). According to the above authors and the results obtained in this study, site fertility is important for the establishment of the SRC of G. arborea since some of the sites analyzed in Costa Rica showed survival rates of 95% due to favorable site conditions. In relation to D. panamensis, it was reported that mortality was 50% at 36 months (Gaitan-Alvarez et al. 2020), values higher than those obtained for these species in the presented study (Fig. 2b). The fact that D. panamensis is a species with less mortality seems to indicate that it is the species that is best adapted to the conditions of the site.
Tree height and diameter increased with age for all four species (Figs. 3 and 4). The increase in diameter and height with age corresponds to the normal development of trees in the early years, where the tree tries to position itself in height and then begins its development in diameter (Ryan and Yober 1997). For these two dasometric parameters, the effect of spacing was observed; the wider spacings (S4 and S3) presented greater diameter and height than the narrow spacings (S2 and S1) but with a more evident effect on the diameter parameter (Figs. 3 and 4). SCR with high density (narrow spacing, such as S2 and S1) have small diameters due to the high competition between trees (Gspaltl et al. 2013), which was observed in all species studied (Figs. 3 and 4).
This difference in spacing was presented after 22 months for height (Fig. 3) and 12 months for diameter (Fig. 4). The lack of this difference in the first months is attributed to the fact that during these months, the level of competition between the trees is still too low to produce differences (Widyati et al. 2022). Although this study did not determine crown intertwining among trees (the visible evidence that competition begins), it barely started, so competition was low (Li et al. 2017). From a physiological point of view, trees during their early years will focus their development mainly on stability and subsistence in order to survive (Li et al. 2017), so at early ages, the tree’s growth will be in height at narrow spacings such as S3 and S4 (Fig. 3), which produce greater competition. This spacing presents less development than the wider spacings such as S1 and S2 (Fig. 3), since diameter growth is not important for survival.
The average basal area is an important parameter widely used in plantations for sawlog production (Niemczyk 2021). The narrower spacings (S1 and S2) presented higher basal area averages than the wider spacings (S3 and S4) in the four species (Fig. 5). This behavior was to be expected, since the basal area is defined as the sum per unit area of all the trees, which means that it is a combination of the diameter and the quantity of trees. Therefore, wider spacings, such as S3 and S4, will present a greater basal area than those with the lowest density, such as S1 and S4. This result agrees with the eucalyptus species growing in SRC (Rockwood et al. 2019). On the other hand, it is observed that in C. alliodora (Fig. 5a), G. arborea (Fig. 5c), and T. grandis (Fig. 5c), a decrease in basal area in S2 spacing was observed at the age of 34 months. The performance of these trees suggests they are already entering the competition, so it would be prudent to harvest these species if that spacing is used (Rockwood et al. 2019).
In general, the G. arborea trees presented the highest height, diameter, and basal area, followed by T. grandis, C. alliodora, and D. panamensis (Figs. 3-5). G. arborea and T. grandis are exotic species widely used in commercial reforestation for sawlog production with high production (Murillo 2018), but C. alliodora and D. panamensis (native species of Costa Rica) grow slowly. Mainly D. panamensis (Murillo 2018). G. arborea and T. grandis in SRC systems also showed higher production. Then the use of species in plantations for biomass production could benefit from the development of sawlog production techniques such as clonal reproduction, management, control of pests and diseases, and logging. However, for the other native species (C. alliodora and D. panamensis), it is still necessary to improve the previous aspects to have greater growth.
Biomass
The lack of differences in the biomass volumes for different parts of the tree as a function of the spacings (Table 1) may be due to the high variability observed (variation coefficients higher than 20%) within each species. The higher variability is attributed to differences in soil fertility, topography, microclimate, and previous uses of the soil (Stolarski et al. 2011). Although the area where the trial was established was small, differences in topography were observed across the different blocks where plots were planted. One part of the first block presented a greater slope in relation to the second and third plots, which were flatter. In addition, the third block presented moisture content problems. All these factors contributed to variation in the growth of the trees, mainly due to mortality (Fig. 2). Tree mortality caused spaces to be generated within the same unit, which led to trees close to these spaces to present greater growth in relation to other trees in the same plot (Domec et al. 2017), which explains the high variability observed at the level of the biomass and therefore the lack of differences between the four spacings evaluated (Fig. 2 and Table 1).
Regarding biomass distribution, Biomasstrunk presented the highest values in all species/spacings, while biomass distribution in other parts of trees varied among species (Fig. 6). According to these results, the biomass distribution was independent of the spacing and was related to the tree morphology of each species. In general, a high percentage of biomass is concentrated in stems and branches in trees growing in SRC systems (Djomo et al. 2015), as occurred in all species except for D. panamensis. C. alliodora and G. arborea tended to produce a higher percentage of biomasstrunk and biomassbranch. Figure 6 shows that D. panamensis produced high percentages of biomasstrunk and biomassleaves, and T. grandis produced high percentages of biomasstrunk and biomassbark (Fig. 6).
The architecture of the trees growing in SRC has been recently studied, and it is mentioned that the leaf area is the most important part of biomass production (Schwerz et al. 2020; Tenorio et al. 2018). But C. alliodora and G. arborea disagreed with these results; the highest biomasstrunk and biomassbranch were found, and the lowest values were found in biomassleaves (Figs. 6a and 6c). Meanwhile D. panamensis and T. grandis exhibited a higher percentage of biomassleaves (Figs. 6b and 6d). In the juvenile stage, the tree develops roots and leaves to capture the nutrients from the environment (soil and air) necessary to grow and survive (Guo et al. 2015; Mensah et al. 2016). So, it is to be expected that the biomass distribution in D. panamensis and T. grandis was different than in the other two species, where high biomass was found in leaves at 34 months old. In fact, these two species presented the highest percentages and lower mortality rates (Fig. 2), which is an indicator that the tree needs significant leaf area to be able to keep growing in SRC systems.
Comparing biomass production with other studies, only G. arborea and D. panamensis reported biomass production in SRC systems. At 34 months old, G. arborea produced 44 to 66 tons/ha in the present study (Table 1), and these values are consistent with the values reported from 24-month-old plantations (Tenorio et al. 2019a,b). Three different locations in Costa Rica reported 31.5 tons/ha to 63.0 tons/ha and two clones at the same spacing reported 50 to 70 tons/ha. While SRC of D. panamensis reported a production of 6.8 and 24.0 tons/ha in 24-month-old plantations (Gaitan-Alvarez et al. 2020), these values were consistent with values obtained in the present study (Table 1).
Biomass production was highly variable among the different species in the tropical region of Latin America growing in SRC and at different spacings; it could range from 10.00 to 50 tons/ha (Moya et al. 2019). Then the biomass production obtained in four tropical species in Costa Rica argued with those values. An important aspect to highlight about biomass production in four tropical species is that these values can be reached in the USA or EU on older plantations (Dickmann 2006). Besides, the establishing od SCR systems of each of the species in monoculture, could facilitate harvest and transport activities and could be uniformizer combustion operation for energy production.
Another important aspect to mention is that the tree’s biomass above the soil level (trunk, bark, branches, and leaves) was measured in the present study, from of these biomasses, trunk, bark, and branches must be collected during the harvesting using an efficient utilization system. In addition to this, it is advisable that leaves must be left since this part of the tree plays an important role in the sustainability of the soil (Schwerz et al. 2020).
Physical, Energetic, and Chemical Properties
The statistical differences found in SG, density, and MC for the different parts of the tree (Table 2) are basically attributed to SG variations in each species. This physical parameter is an intrinsic property of each species, and several studies (Ogle et al. 2014; Pati et al. 2022) mentioned that this property determines the survival, mechanical stability of the tree, and tolerance to drought, among many other biological, physiological, ecological, and evolutionary functions of the species. However, the growth rate is negatively associated with SG (Muller-Landau 2004). As a result, species tested with a lower diameter (D. panamensis and T. grandis) presented higher SG values. On the contrary, the species with the highest growth rate, C. alliodora and G. arborea, presented lower SG (Table 2). In general, considering the SG parameter in wood produced in plantations for sawlog production and its application to biomass produced in SCR systems, D. panamensis and T. grandis are classified as very heavy and heavy wood species, respectively (Moya et al. 2019), while C. alliodora and G. arborea are classified as moderately light woods (Moya et al. 2019).
It was mentioned that SG is related to other biomass parameters, such as MC and density; MC is negatively correlated with SG, while for density, the trend is not clear (Muller-Landau 2004). However, these two parameters have an important influence on biomass utilization. Species with high MC values need more energy during drying, which decreases the amount of energy they supply (Rodrigues et al. 2021). Thus, G. arborea and T. grandis, due to high MC, present unfavorable MC conditions (Table 2), and on the contrary, C. alliodora and D. panamensis present more favorable moisture conditions with low MC values (Table 2). While the density parameter has implications during the transport of biomass, species with high density present greater weight in less volume, so species such as D. panamensis, G. arborea, and T. grandis are of high weight in transport, while C. alliodora does not present this condition. In addition, this last species has a low MC, which makes it more favorable in relation to the other species.
In relation to the spacing, the physical, energy, and chemical properties presented low differences between the spacings at 34 months (Tables 2 and 3). Some differences were observed in SG, density, and MCtrunk of C. alliodora, D. panamensis, and G. arborea (Table 2). Firstly, there was a tendency to decrease the SG with increasing spacing, from S1 to S4. This result agreed with other studies of these species (Tenorio et al. 2016, 2018; Gaitan-Alvarez et al. 2020), where SG decreased with spacing.
Regarding the energy properties, some differences were observed between species. For example, low values of ash content and differences between C and H content were observed in G. arborea, but in other species, they were not observed. According to this result, the energy properties were found to be uniform among species and between spacings. For example, there were no differences at the level of branches in D. panamensis and T. grandis, in the H content of D. panamensis and G. arborea, in the C/H ratio of the trunk of all species, or in the branches of D. panamensis (Table 3). Then, according to these results, it is evident that there were few variables that presented differences between species and spacing, which indicates that the biomass of the four species is relatively uniform, a situation that is common when biomass comes from woody species (Boggia et al. 2022).
CONCLUSIONS
- The growth parameters of trees (mortality, diameter, height, and basal area) and characteristics and production of biomass for the four species tested showed differences between species. There were three species (G. arborea, C. alliodora, and T. grandis) that presented important potential for use in SRC systems. G. arborea was the species with the highest production but a high mortality rate; however, this is a problem due to inappropriate management and initial establishment. On the other hand, narrow spacings, such as 0.5×1.0 m or 1.0×1.0 m, produced the highest biomass production. However, the trees produced were smaller in diameter and height at 34 months old.
- The evaluation of the physical properties of biomass (specify gravity, density, and moisture content) and parameters related to logging, transport, drying, processing, and energy densification are related to the intrinsic properties of each species, so the spacing effect presented little effect on physical properties. In addition, the few variations in energy properties per species and spacing presented an important advantage from the point of view of its energy use and performance in industrial processes. These results suggested that four species at different spacings were uniform in energy and chemical properties.
ACKNOWLEDGMENTS
The authors wish to thank the Vicerrectoría de Investigación y Extensión of the Instituto Tecnológico de Costa Rica (ITCR) for the economic support given to this research. Many thanks also to Juan Carlos Corrales for providing support in the establishment and management of the plantations.
REFERENCES CITED
Abuelnuor, A. A., Wahid, M. A., Hosseini, S. E., Saat, A., Saqr, K. M., Sait, H. H., and Osman, M. (2014). “Characteristics of biomass in flameless combustion: A review,” Renew. Sust. Energ. Rev. 33, 363-370. DOI: 10.1016/j.rser.2014.01.079
Alonso, D. M., Hakim, S. H., Zhou, S., Won, W., Hosseinaei, O., Tao, J., Garcia-Negron, V., Motagamwala, A. H., Mellmer, M. A., Huang, K., and Houtman, C. J. (2017). “Increasing the revenue from lignocellulosic biomass: Maximizing feedstock utilization,” Sci. Adv. 3(5), article 1603301. DOI: 10.1016/j.rser.2014.01.07910.1126/sciadv.16033
Amichev, B. Y., Hangs, R. D., Konecsni, S. M., Stadnyk, C. N., Volk, T. A., Bélanger, N., Vujanovic, V., Schoenau, J. J., Moukoumi, J., and Van Rees, K.C. (2014). “Willow short-rotation production systems in Canada and Northern United States: a review,” Soil. Sci. Soc. Am. J. 78(S1), S168-S182. DOI: 10.2136/sssaj2013.08.0368nafsc
Amjith, L. R., and Bavanish, B. (2022). “A review on biomass and wind as renewable energy for sustainable environment,” Chemosphere 293, article 133579. DOI: 10.1016/j.chemosphere.2022.133579
ASTM D5865-19 (2019). “Standard test method for gross calorific value of coal and coke,” ASTM International, West Conshohocken, PA. DOI: 10.1520/D5865_D5865M-19
ASTM D4442-20 (2020). “Standard test methods for direct moisture content measurement of wood and wood-based materials,” ASTM International, West Conshohocken, PA. DOI: 10.1520/D4442-20
ASTM D1102-21(2021). “Standard test method for ash in wood,” ASTM International, West Conshohocken, PA. DOI: 10.1520/D1102-84R21
ASTM D143-22 (2022). “Standard test methods for small clear specimens of timber,” ASTM International, West Conshohocken, PA. DOI: 10.1520/D0143-22
Boggia, A., Paolotti, L., Martino, G. and Rocchi, L. (2022). “Comparative analysis of different alternatives for sustainable short rotation woody crops in Central Italy,” Sci. Total Environ 836, 155638. DOI: 10.1016/j.scitotenv.2022.155638
DeBell, D. S., Clendenen, G. W., Harrington, C. A. and Zasada, J. C. (1996). “Tree growth and stand development in short-rotation Populus plantings: 7-year results for two clones at three spacings,” Biomass Bioenergy 11(4), 253-269. DOI: 10.1016/0961-9534(96)00020-7
Dickmann, D. (2006). “Silviculture and biology of short-rotation woody crops in temperate regions: Then and now,” Biomass Bioenergy 30, 696-705. DOI: 10.1016/j.biombioe.2005.02.008
Djomo, S. N., Ac, A., Zenone, T., De Groote, T., Bergante, S., Facciotto, G., Sixto, H., Ciria, P., and Ceulemans, R. (2015). “Energy performances of intensive and extensive short rotation cropping systems for woody biomass production in the EU,” Renew. Sust. Energ. Rev. 41, 845-854. DOI: 10.1016/j.rser.2014.08.058
Dickmann, D. (2006). “Silviculture and biology of short-rotation woody crops in temperate regions: Then and now,” Biomass Bioenergy 30, 696-705. DOI: 10.1016/j.biombioe.2005.02.008
Dillen, S. Y., Djomo, S. N., Al Afas, N., Vanbeveren, S., and Ceulemans, R. (2013). “Biomass yield and energy balance of a short-rotation poplar coppice with multiple clones on degraded land during 16 years,” Biomass Bioenergy 56, 157-165. DOI: 10.1016/j.biombioe.2013.04.019
Domec, J. C., Ashley, E., Fischer, M., Noormets, A., Boone, J., Williamson, J. C., and King, J. S. (2017). “Productivity, biomass partitioning, and energy yield of low-input short-rotation American sycamore (Platanus occidentalis L.) grown on marginal land: Effects of planting density and simulated drought,” BioEnergy Res. 10, 903-914. DOI: 10.1007/s12155-017-9852-5
Eisenbies, M. H., Volk, T. A., DeSouza, D., Hallen, K., Stanton, B., Espinoza, J., Himes, A., Shuren, R., Stonex, R., Summers, B., and Zerpa, J. (2021). “An assessment of the harvesting and fuel performance of a single-pass cut-and-chip harvester in commercial-scale short-rotation poplar crops as influenced by crop and weather conditions,” Biomass Bioenergy 149, article 106075. DOI: 10.1016/j.biombioe.2021.106075
Gspaltl, M., Bauerle, W., Binkley, D., and Sterba, H. (2013). “Leaf area and light use efficiency patterns of Norway spruce under different thinning regimes and age classes,” For. Ecol. Manag. 288, 49-59. DOI: 10.1016/j.foreco.2011.11.044.
Gaitan-Alvarez, J., Moya, R., Tencio, D., and Arias-Aguilar, D. (2020). “Evaluation of changes in tree morphology parameters, yield, chemical and energy properties of short rotation three-year-old energy plantations of Dipteryx panamensis in Costa Rica,” Rer. Arvore 44, article e4414. DOI: 10.1590/1806-908820200000014
Giudicianni, P., Gargiulo, V., Grottola, C. M., Alfè, M., Ferreiro, A. I., Mendes, M. A. A., Fanano, F., and Ragucci, R. (2021). “Inherent metal elements in biomass pyrolysis: A review,” Energy Fuels 35(7), 5407-5478. DOI: 10.1021/acs.energyfuels.0c04046
Guo, T., Engel, B. A., Shao, G., Arnold, J. G., Srinivasan, R., and Kiniry, J. R. (2015). “Functional approach to simulating short-rotation woody crops in process-based models,” BioEnergy Res. 8(4), 1598-1613. DOI: 10.1007/s12155-015-9615-0
Ile, O. J., McCormick, H., Skrabacz, S., Bhattacharya, S., Aguilos, M., Carvalho, H. D., Idassi, J., Baker, J., Heitman, J. L., and King, J. S. (2022). “Integrating short rotation woody crops into conventional agricultural practices in the Southeastern United States: A review,” Land 12(1),10. DOI: 10.3390/land12010010
Hernández-Chaverri, R. A., and Buenrostro-Figueroa, J. J. (2021). “Biomass: Biorefinery as a model to boost the bioeconomy in Costa Rica, a review,” Agron. Mesoamericana 32(3), 1047-1070. DOI: 10.15517/AM.V32I3.43736
Johnston, C. R., Walsh, L. R., and McCracken, A. R. (2022). “Effect of two vs. three years harvest intervals on yields of Short Rotation Coppice (SRC) willow,” Biomass Bioenergy 156, article 106303. DOI: 10.1016/j.biombioe.2021.106303
Laureysens, I., Bogaert, J., Blust, R., and Ceulemans, R. (2004). “Biomass production of 17 poplar clones in a short-rotation coppice culture on a waste disposal site and its relation to soil characteristics,” For. Ecol. Manag.187(2-3), 295-309. DOI: 10.1016/j.foreco.2003.07.005
Li, Y., Kröber, W., Bruelheide, H., Härdtle, W., and Von Oheimb, G. (2017). “Crown and leaf traits as predictors of subtropical tree sapling growth rates,” J. Plant Ecol. 10(1), 136-145. DOI: 10.1093/jpe/rtw041.
Mensah, S., Kakaï, R. G., and Seifert, T. (2016). “Patterns of biomass allocation between foliage and woody structure: the effects of tree size and specific functional traits,” Ann. For. Res. 59(1), 49-60. DOI: 10.15287/afr.2016.458
Moya, R., Tenorio, C., and Oporto, G. (2019). “Short rotation wood crops in Latin American: a review on status and potential uses as biofuel,” Energies 12(4), 705. DOI: 10.3390/en12040705
Muller-Landau, H. C. (2004). “Interspecific and inter-site variation in wood specific gravity of tropical trees,” Biotropica 36(1), 20-32. DOI: 10.1111/j.1744-7429.2004.tb00292.x
Murillo, O. (2018). “¿Cuáles especies forestales nativas debemos priorizar en el país?,” Ambientico 267, 4-10.
Navarro-Camacho, R., Esquivel-Segura, E., Briceño-Elizondo, E., and Arias-Aguilar, D. (2014). “Estimating aboveground biomass for Eucalyptus saligna Sm. and Eucalyptus camaldulensis Dehn in the center region of Costa Rica,” Rev. For. Mesoamericana Kuru 11(27), 22-33.
Niemczyk, M. (2021). “The effects of cultivar and rotation length (5 vs. 10 years) on biomass production and sustainability of poplar (Populus spp.) bioenergy plantation,” GCB Bioenergy 13, 999-1014. DOI: 10.1111/gcbb.12827
Ogle, K., Pathikonda, S., Sartor, K., Lichstein, J. W., Osnas, J. L., and Pacala, S. W. (2014). “A model‐based meta‐analysis for estimating species‐specific wood density and identifying potential sources of variation,” J. Ecol. 102(1), 194-208. DOI: 10.1111/1365-2745.12178
Paris, P., Mareschi, L., Sabatti, M., Pisanelli, A., Ecosse, A., Nardin, F., and Scarascia-Mugnozza G. (2011). “Comparing hybrid Populus clones for SRF across northern Italy after two biennial rotations: survival, growth and yield,” Biomass Bioenergy 35, 1524-1532. DOI: 10.1016/j.biombioe.2010.12.050
Pati, P. K., Kaushik, P., Khan, M. L. and Khare, P. K. (2022). “Wood specific gravity in Indian forests: A review,” Int. J. Ecol. Environ. Sci. 48(2), 143-164. DOI: 10.55863/ijees.2022.0111
Pleguezuelo, C. R. R., Zuazo, V. H. D., Bielders, C., Bocanegra, J. A. J., PereaTorres, F. and Martínez, J. R. F. (2015). “Bioenergy farming using woody crops. A review,” Agronomy Sust. Develop. 35(1), 95-119. DOI: 10.1007/s13593-014-0262-1
Popp, J., Kovács, S., Oláh, J., Divéki, Z. and Balázs, E. (2021). “Bioeconomy: Biomass and biomass-based energy supply and demand,” New Biotechnol. 60, 76-84. DOI: 10.1016/j.nbt.2020.10.004
Rodrigues, A. M., Costa, M. M., and Nunes, L. Jr. (2021). “Short rotation woody coppices for biomass production: An integrated analysis of the potential as an energy alternative,” Curr. Sustain./Renew. Energy Rep. 8, 70-89. DOI: 10.1007/s40518-020-00171-3
Rockwood, D. L., Ellis, M. F., Liu, R., Zhao, F., Ji, P., Zhu, Z., Fabbro, Kw., Ke, A., and Cave, R. D. (2019). “Short rotation eucalypts: Opportunities for biochar,” Forests 10(4), 314. DOI: 10.3390/f10040314
Salazar-Zeledón, E. S. (2016). “Influencia de altas densidades de plantación en el poder calorífico y propiedades físicas de la madera para la especie Gmelina arborea Roxb. ex Sm,” Rev. For. Mesoamericana Kurú 13(30), 51-56.
Santos, K. F. D., and Reichert, J. M. (2022). “Best tillage practices for eucalyptus growth and productivity: A review on the Brazilian experience,” Rer. Brasileira de Ciência Solo 46, article e0210091.
Schwerz, F., Neto, D. D., Caron, B. O., Nardini, C., Sgarbossa, J., Eloy, E., Behling, A., Elli, E. F., and Reichardt, K. (2020). “Biomass and potential energy yield of perennial woody energy crops under reduced planting spacing,” Renew. Energy 153, 1238-1250. DOI: 10.1016/j.renene.2020.02.074
Silva, D. A. L., Filleti, R. A. P., Musule, R., Matheus, T. T., and Freire, F. (2022). “A systematic review and life cycle assessment of biomass pellets and briquettes production in Latin America,” Renew. Sust. Energ. Rev. 157, article 112042. DOI: 10.1016/j.rser.2021.112042
Stolarski, M. J., Szczukowski, S., Tworkowski, J., Wróblewska, H., and Krzyżaniak, M. (2011). “Short rotation willow coppice biomass as an industrial and energy feedstock,” Ind. Crop. Prod. 33, 217-223. DOI: 10.1016/j.indcrop.2010.10.013.
Shukla, S. R., and Viswanath, S. (2021). “Comparative financial analysis of plantation teak (Tectona grandis Lf) under different management practices in farmlands,” Indian J. Agrofor. 23(2), 107-117.
Tenorio, C., Moya, R., Arias-Aguilar, D., and Briceño-Elizondo, E. (2016). “Biomass yield and energy potential of short-rotation energy plantations of Gmelina arborea one year old in Costa Rica,” Ind. Crop. Prod. 82, 63-73. DOI: 10.1016/j.indcrop.2015.12.005
Tenorio, C., Moya, R., and Arias-Aguilar, D. (2018). “Evaluation of changes in tree morphology parameters, biomass yield, chemical and energy properties at three spacings of short rotation energy plantations of Gmelina arborea in Costa Rica, from one to two years of age,” Waste Biomass Valori. 9(7), 1163-1179. DOI: 10.1007/s12649-017-9896-y
Tenorio, C., Moya, R., Ortiz-Malavassi, E., and Arias, D. (2019a). “Production and regression models for biomass and carbon captured in Gmelina arborea Roxb. trees in short rotation coppice plantations in Costa Rica,” Forests 10(7), 593. DOI: 10.3390/f10070593
Tenorio, C., Moya, R., Valverde, J. C., and Arias-Aguilar, D. (2019b). “Biomass production and characteristics of short rotation plantations of clones of in three spacings,” Silvae Genet. 68(1), 92-100. DOI: 10.2478/sg-2019-0017
Valverde, J. C., Arias, D., Campos, R., Jiménez, L. D., and Morales, J. P. (2022). “Effects of planting spacing on chemical, physical and energetic properties of biomass accumulation in a plantation of Eucalyptus tereticornis Sm,” CERNE 28, 2-8. DOI: 10.1590/01047760202228012930
Valverde, J. C., Arias, D., Campos, R., Jiménez, M. F., and Brenes, L. (2021). “Forest and agro-industrial residues and bioeconomy: perception of use in the energy market in Costa Rica,” Energy. Ecol. Environ. 6(3), 232-43. DOI: 10.1007/s40974-020-00172-4
Widyati, E., Sutiyono, D., Mindawati, N., Yulianti, M., Prameswari, D., Abdulah, L., Yuniarti, K., and Baral, H. (2022). “Optimum plant density and harvest age for maximizing productivity and minimizing competition in a Calliandra short-rotation-coppice plantation in West Java, Indonesia,” For. Sci. Technol. 18(1), 26-35. DOI: 10.1080/21580103.2022.2039305
Yáñez, M. A., Zamudio, F., Espinoza, S., Ivković, M., Guerra, F., Espinosa, C., and Baettig, R. M. (2019). “Genetic variation and growth stability of hybrid poplars in high-density short-rotation coppice stands in central Chile,” Biomass Bioenergy 120, 84-90. DOI: 10.1016/j.biombioe.2018.11.011
Article submitted: September 25, 2023; Peer review completed: November 27, 2023; Revised version received and accepted: November 29, 2023; Published: December 5, 2023.
DOI: 10.15376/biores.19.1.695-715