
Abstract
This paper presents the results of a study on seismic performance of mortise-tenon joints with different lengths that tenons pull out of joints. Three 1:3.52 scaled mortise-tenon joint specimens were fabricated: one with through-tenon joints, one with half-tenon joints, and one with dovetail joints. Seismic data of the joints, such as hysteretic curves, skeleton curves, stiffness degradation rules, and energy dissipation capacity curves, were obtained by low-cycle reversed loading test. The influence of lengths that tenons pull out of joints on the mortise-tenon joints was analyzed. The seismic performance of three types of mortise-tenon joints was compared. The results showed that all hysteretic loops are z shaped. The seismic performance of the through joint was the best among three types of mortise tenon joint. The length that the tenon pulls out of the joint significantly affected the performance of the mortise and tenon joints.
Download PDF
Full Article
Experimental Study on Seismic Performance of Chinese Traditional Mortise and Tenon Joints with Different Lengths that Tenons Pull out of Mortise
Junhong Huan,a,b,c,d Tianyang Chu,a,b Xiaodong Guo,c,d,* Zemeng Sun,a,b Xiaoyi Zhou,a,b Wei Wang,c,d and Yating Yang c,d,e
This paper presents the results of a study on seismic performance of mortise-tenon joints with different lengths that tenons pull out of joints. Three 1:3.52 scaled mortise-tenon joint specimens were fabricated: one with through-tenon joints, one with half-tenon joints, and one with dovetail joints. Seismic data of the joints, such as hysteretic curves, skeleton curves, stiffness degradation rules, and energy dissipation capacity curves, were obtained by low-cycle reversed loading test. The influence of lengths that tenons pull out of joints on the mortise-tenon joints was analyzed. The seismic performance of three types of mortise-tenon joints was compared. The results showed that all hysteretic loops are z shaped. The seismic performance of the through joint was the best among three types of mortise tenon joint. The length that the tenon pulls out of the joint significantly affected the performance of the mortise and tenon joints.
DOI: 10.15376/biores.19.1.478-499
Keywords: Ancient timber buildings; Mortise-tenon joints; Seismic performance
Contact information: a: School of Civil Engineering, Shijiazhuang Tiedao University, Shijiazhuang, PR China; b: Key Laboratory of Roads and Railway Engineering Safety Control (Shijiazhuang Tiedao University), Ministry of Education, Shijiazhuang 050043; c: Faculty of Architecture, Civil and Transportation Engineering, Beijing University of Technology, Beijing, PR China; d: Key Scientific Research Base of Safety Assessment and Disaster Mitigation for Traditional Timber Structure (Beijing University of Technology), State Administration for Cultural Heritage, Beijing 100124, China; e: The College of Urban Construction, Hebei Normal University of Science & Technology, Qinhuangdao 066000, China; *Corresponding author: guoxd7797@163.com
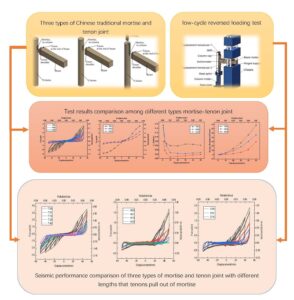
GRAPHICAL ABSTRACT

INTRODUCTION
Chinese ancient architecture is an important part of Chinese civilization. According to Sun (2011), the number of existing Chinese ancient buildings is about 264,000. A large proportion of them are timber buildings, such as the Forbidden City in Beijing (Liang 2005). Chinese ancient timber structures architecture plays an important role in the history of world architecture in terms of its special aesthetic, artistic and cultural value; they are national treasures of China. However, data shows (Liang 1984) that since 2221 B.C., nearly 6,000 medium and strong earthquakes occurred in China and a large amount of ancient buildings were damaged and destroyed in the earthquakes. According to historical seismic data, 2 world cultural heritage sites and 169 national key cultural relics protection units were damaged in the Wenchuan earthquake (Wang et al. 2003). Therefore, it is important to conduct seismic research on ancient timber buildings to preserve this valuable cultural heritage.
Research on ancient buildings in China started in the 1980s. Liang Sicheng did a lot of research on the Chinese ancient buildings from the perspective of architecture (Liang 2005). Different from modern architecture, the beams and columns of Chinese ancient timber structures are connected by mortise-tenon joints without any nails, steel plates, or bolts. Therefore, mortise and tenon joints are key loading bearing and transmission parts of timber structures. Dutu et al. (2016), Vieux-Champagne et al. (2014), and Xie et al. (2019) investigated the seismic performance of timber frame systems with infill by cyclic load tests. Wu et al. (2018), Fang et al. (2001), and Shi et al. (2018) conducted experimental and numerical simulation studies on traditional Chinese timber frame structures to investigate their stiffness, damage modes, and other properties. Ali et al. (2012; 2022), Yeo et al. (2016), and Kaori (2019) investigated the dynamic performance of timber frame structures through experiments. Aejaz et al. (2021) used numerical simulations to evaluate the effect of geometric modifications on joint behavior.
Among the various types of mortise-tenon joints, the through-tenon joint, the half tenon joint, and the dovetail joint are the most widely used types of joints in Chinese ancient timber structures. Mortise-tenon joints help ensure the safety of ancient timber buildings in earthquakes (Ma 1991; Fang et al. 2000; Bai and Ma 2018). The mortise-tenon joints can bear and transmit loads and consume seismic energy when large structural deformation occurs in the earthquake. The mortise and tenon joints are important earthquake-resistant structural elements of timber structures (Chang et al. 2004; Zhao et al. 2012; Wu et al. 2019). Zhi (2014), Shields and Hindman (2015), Parisi and Piazza (2000), Hu et al. (2018), and Sha et al. (2021) investigated the mechanical properties of different types of mortise-tenon joints in timber structures. Experimental studies (Chen et al. 2016a; Crayssac et al. 2018) were carried out to investigate the mortise-tenon joints’ mechanical properties and seismic performance. Huan et al. (2019) put forward several reinforcement methods to enhance the mechanical properties of mortise-tenon joints. Shanks et al. (2008, 2009) performed pull-out tests on mortise-tenon joints and studied the stiffness, strength and failure modes of the test models.
Earthquakes (Yang et al. 2000), long-term loads, drying shrinkage (Xu 2006), and other natural environment erosion exacerbated the damage of mortise and tenon joints, especially the tenon pull out of mortise (King et al. 1996). Under the effect of earthquakes, the connection between column and beams loosened. The tenon pulls out, which reduces the load-bearing capacity and integrity of the whole structure. Therefore, it is necessary to investigate the seismic performance of the mortise tenon joints with gaps between mortise and tenon shoulder. Some scholars have studied the seismic performance of mortise-tenon joints with gaps in traditional timber structures. Xue et al. (2017, 2016) studied through-tenon joint and dovetail tenon joints with different looseness and damage degree based on model tests. The results showed that the looseness and damage decrease the energy dissipation capacity and rotational stiffness of the mortise tenon joints. Zhou and Yang (2017) studied structural health problems of mortise-tenon joints of timber buildings in the Forbidden City and recommended some strengthening methods for these tenon-mortise joints. However, studies on the seismic performance of mortise and tenon joints with different lengths that tenon pull out of mortise are rare.
In this study, three 1/3.52 scaled specimens of Chinese traditional timber mortise tenon joints for testing, including one through-tenon joint, one half tenon joint and one dovetail tenon joint, were fabricated according to Ying Zao Fa Shi in Song Dynasty (1950). The low-cycle reversed loading tests were conducted to investigate the seismic performance of different types of mortise-tenon joints. The effects of different lengths tenon pull out of mortise on the seismic performance of the joints were studied. The seismic performance of three types of mortise and tenon joints without tenon pull out of mortise were compared.
EXPERIMENTAL
Design and Fabrication of Specimens
One through-tenon joint, one half-tenon joint, and one dovetail tenon joint were fabricated according to Yingzao Fashi (1950). Yingzao Fashi, which was published in 1103 AD, is a specification for building construction in Song Dynasty of China. Three-dimensional views of mortise and tenon joints in the test are shown in Fig. 1. Dimensions of components are shown in Fig. 2. According to the Buckingham theorem (Kline 1965) and similitude theory, the structural properties of the prototype can be calculated by dividing the corresponding properties of the scaled specimens by the scale factors of the dimensions and mechanical properties of the materials (Chen et al. 2016b). Scale factors of the physical parameters are shown in Table 1.

Fig. 1. (a) Through-tenon joint; (b) half tenon joint; (c) dovetail tenon joint
Table 1. Scale Factors of the Physical Parameters


(a)

(b)

(c)
Fig. 2. Dimensions of (a) through-tenon joint; (b) half tenon joint; (c) dovetail tenon joint
Table 2. Lengths that Tenons Pull Out of Mortises of Test Specimens

Different lengths that tenons pull out of mortises were considered to study regarding the seismic behavior of three mortise and tenon joints. The lengths that tenons pull out of mortise were varied with the types of mortise and tenon joints, as shown in Table 2. The length of the test tenons were not the same. Therefore, the lengths that tenons pull out of mortise varied with the types of mortise and tenon joints. In Table 2, T is short for through-tenon joint, H is short for half tenon joint, and D is short for dovetail joint. Mortise and tenon joints without tenon pull out was labeled as T00, H00, and D00. T01, H01, and D01 indicate that the length of a tenon pull out from the mortise is 2 mm. More details are shown in Table 2.
Material Properties
It is prohibited for anyone to take any material samples from the existing ancient timber buildings, on account of their history and cultural values. Pinus sylvestris var. mongolica was selected to fabricate the specimens. Pinus sylvestris var. mongolica grows in Northeast China, and it is a commonly used tree species in the repair and construction replacement of traditional timber structures. Physical and mechanical testing methods for wood were followed according to GB 1927-1943-91 (1992). The compression test was conducted on the wood specimens, which dimension is 30 mm × 20 mm × 20 mm. And the elastic modulus test was conducted on the wood specimens, which dimension is 300 mm × 20 mm × 20 mm (Huan et al. 2022). The mechanical properties of the wood are shown in Table 3.
Table 3. Mechanical Properties of the Wood

Testing and Measuring Schemes
In this test, the column was fixed to the column holder by steel plates and bolts. The column holder was fixed to the ground by steel blots. The beam was fixed to the beam holder. The beam holder was connected to the chassis of the universal testing machine by a hinged support. The test setup is shown in Fig. 3. A steel cap was positioned on the top of the column. Vertical load was applied on the steel cap by a self-balancing jack. The vertical loads were calculated according to the relevant references (Liu 2001a,b; Chen et al. 2016c). Using the similarity theory (Sabnis and Harris 1983; Zhou and Lv 2016), the vertical loads placed on the 1/3.52 scaled model were 4 kN.
Cyclic loadings were applied by the lifting and lowering of the chassis. The loading point was 700 mm from the surface of column horizontally. The forces and displacements of the loading point were collected directly by means of a data acquisition system of universal testing machine to generate load-displacement curves. The cyclic loads were applied under displacement control according to the ISO/FDIS 21581:2010(E) standards (2010). The beam was loaded with three initial cycles with an amplitude of 1 mm. The amplitude of the second, third, and fourth cycles were 3, 5, and 10 mm respectively. Then the amplitude of the cycles gradually increased by a step of 10 mm until the amplitude was 50 mm, which is the maximum range of the test machine. The loading speed was 1 mm/min for 1 to 5 mm and 10 mm/min for 10 to 50 mm for 3 cycles (ISO-16670). Figure 4 presents the shape of the loading history. An overview of the test setup is shown in Fig. 5.
Two displacement transducers (displacement transducer 1 and displacement transducer 2) were attached at opposite faces of the beam to measure the slide length of tenon on the surface of mortise. An inclinometer was attached to one side of the beam to measure the rotation angle.

Fig. 3. Sketch of the test setup

Fig. 4. Loading scheme

Fig. 5. Overview of the test setup
RESULTS AND DISCUSSION
All the mortise and tenon joints were loaded until the displacement reached 50 mm (the drift angle was 1/12). Three types of mortise tenon joins had similar failure modes. When the specimens were pushed upward and downward, the surface of mortises and tenons squeezed with each other. As the loading displacements increased, elastic compression of the contact surfaces turned into plastic compression. The plastic compression increased while loading displacements increased, which increased the gaps between mortise and tenon. However, there were slight differences among the failure modes of mortise and tenon joints.
Through-Tenon Joints
At the beginning of the loading process, the loading displacements reached ±1mm to ±10 mm (the drift angle was 1/60); no obvious damage was observed on the mortise-tenon joints. There was no residual gap between tenon shoulder and mortise at the maximum displacement of every loading cycle. When the loading displacement reached ± 30 mm (the drift angle was 1/20), slight plastic deformation was observed on the tenon. Residual gaps between tenon shoulder and mortise were observed at the maximum displacement of ±30 mm loading cycle. This means that repeated cyclic loading makes the tenon become loose from the mortise. With the increasing of loading displacements, the mortise and tenon joint began to creak under the load. However, no signs of cracking or the original cracks getting bigger could be observed from the outside. This indicates that the mortise and tenon squeezed tighter while the loading displacements were getting bigger, which made these two components rub together. The tenon slid on the surface of the mortise, making a creaking noise. Slight plastic deformation was observed on the end of the tenon after the test, as shown in Fig. 6(a).

Fig. 6. Damages of through-tenon joints: (a) Deformation of tenon; (b) Residual gaps; (c) Cracks in the tenon; (d) Deformation of tenon and looseness of mortise and tenon joint
At the end of the first loading test, the residual gaps between tenon shoulder and mortise release were about 5 mm. Plastic deformation was observed on the contact surface of tenon and mortise. The initial length that tenon pull out of mortise, which also is the width gap between mortise and tenon, was 2 mm. The gap was small, and the test observations of T01 were similar with T00. When the test of T01 finished, the residual length that tenon pull out of mortise was 5 mm, as shown in Fig. 6(b). After the test, there were cracks in the tenon, as shown in Fig. 6(c). When the initial gaps were 10, 20, and 40 mm respectively, the test observations were generally similar with the first loading test of T00. The difference is the creaking sounds that were caused by the rubbing of mortise and tenon appeared at bigger loading displacements. The creaking sounds generally appeared in the unloading process (i.e., the process that loading displacements return to 0 mm). The greater the number of cycles, the greater the degree of looseness in the mortise-tenon joint and the bigger the deformation of the tenon, as shown in Fig. 6(d). The bigger the length that tenon pulls out of the mortise, the smaller the contact area between mortise and tenon. When the length reached 30 mm (the drift angle was 1/20), there was no contact point between the beams and columns except for the mortise and tenon.
Half Tenon Joints
The test observations of H00, H01, H10, and H20 were similar. No obvious damage was observed on the mortise-tenon joints when the loading displacements were ±1mm~±10 mm (the drift angle was 1/600 and 1/60). In the test of H00 and H01, there were no residual gaps between mortise and tenon shoulder after the test. As the loading displacements increased, plastic deformation occurred on the contact surface of the tenon and mortise, as shown in Fig. 7(a) The mortise and tenon squeezed tighter while the loading displacements became bigger. The tenon slid on the surface of the mortise. Creaking noises were audible when the loading displacements reached ±40 mm and ±50 mm (the drift angle was 1/15 and 1/12). The residual gaps increased while the initial lengths that tenon pulled out of mortise increased, as shown in Fig. 7(b).

Fig. 7. Damages of half tenon joints: (a) Plastic deformation of tenon; (b) Residual gap
Dovetail Tenon Joints
In the case of dovetail tenon joints, the test observations of D00, D01, and D10 were similar. No obvious damage was observed on the mortise-tenon joints when the loading displacements were ±1 mm to ±10 mm (the drift angle was 1/600 and 1/60). In the test of D00, when the loading displacements reached ±20 mm (the drift angle was 1/30), plastic deformation occurred on the contact surfaces of the mortise and tenon. Creaking sounds were heard during the unloading process. After the test, there was no residual gap between mortise and tenon shoulder. The test observations of D01 were similar with D00. In the test of D10, the initial length that tenon pulled out of mortise was 10 mm. When the loading displacements reached ±30 to ±50 mm (the drift angle was 1/20 to 1/12), the beam and column began to squeeze each other. Rubbing sounds between mortise and tenon joints could be heard during the unloading process. After the loading was completed, the residual length that tenon pulled out of mortise was 10 mm. Damages of dovetail tenon joints are shown in Fig. 8.

Fig. 8. Damages of dovetail tenon joints: (a) Deformation of dovetail tenon; (b) Residual length that tenon pulled out of mortise
Hysteretic Curves
Hysteretic curves of through, half, and dovetail tenon joints with different lengths that tenon pulls out of mortise are shown in Fig. 9. All hysteresis curves were “Z” shaped. At the beginning of every displacement loading cycle in the positive and negative directions, slopes of the curves were small. The slopes of curves increased with increasing loading displacements. All specimens for testing were fabricated by traditional craftsmen, and there are errors between the actual sizes of the specimens and the design sizes. At the beginning of loading process, the mortise and tenon contacted each other and there was tenon slide on the surface of mortise. Therefore, slopes of curves were small at first. As the loading displacements increased, the mortise and tenon squeezed tightly. Then the slopes of curves increased rapidly until reaching the maximum loading displacements.
All the loading displacements of every loading level were cycled three times. The peak values of the first cycle of every loading level were the biggest, and the third level were the smallest. The pinching effects of curves were more obvious. During the loading process, values of the curves in the third cycle were smaller than that of second cycle, and values of second values were smaller than that of first cycle. This mainly was because the repeated loading had caused structural damage in the mortise and tenon joints. When the loading displacements increased, plastic deformation and cracks occurred on the mortise and tenon. This caused and aggravated the gaps width of mortise and tenon. The tenon will be more prone to sliding in the mortise. This decreases the peaking values of curves and bearing capacity of the joints.
The loading displacements were symmetrical. Downwards is the positive direction, whereas upwards is the negative direction. The hysteresis curves are asymmetric. This is mainly because all the specimens were handmade, and consequently there were errors in the sizes. The gaps between tenon upper surface and mortise were bigger than that of tenon lower surface and mortise.
At the same level of loading displacement, the pinching effect of the hysteresis curve became more obvious with the increase of the initial lengths of tenon that had pulled from the mortise. The values of curves are also decreased with the increase of the initial lengths of tenon pulled out from the mortise. The slopes of curves showed the same changing trend. The mainly was because the further that the tenon pulls out of tenon, the smaller is the contact area between tenon and mortise. This increases the probability of tenon sliding, and it decreases the peak values of curves and bearing capacity of the joints.

Fig. 9. Hysteretic curves of force-displacement: (a) Through-tenon joint; (b) Half tenon joint; (c) Dovetail tenon joint
The peak values of curves in the positive direction in the test of T40 were about 1/3 of T00. The peak values of curves in the negative direction in the test of T40 were about 1/2 of T00. In the test of T01, the length that the tenon pulled out of the mortise was 2 mm, and the peak values of curves in the positive and negative direction were about 80% of that in test of T00. In the test of T10, the length that the tenon pulled out of the mortise was 10 mm, and the peak values of curves in the positive and negative direction were about 50% and 78% of that in test of D00 respectively. In the test of T20, the length that the tenon pulled out of the mortise was 20 mm, and the peak values of curves in the positive and negative direction were about 40% and 70% of that in test of D00 respectively.

Fig. 10. Hysteresis curves of through, half and dovetail tenon joints with no gap between mortise and tenon shoulder
When the initial gaps between mortise and tenon shoulder of the half tenon joint reached 20 mm (the drift angle was 1/30), it was about 1/3 of the tenon length, which was already close to the maximum damage and safety levels stipulated in the GB/T50165 (2020) standard. The structure had reached the maximum level of damage affecting safety when the length that tenon pulls out of mortise reached 2/5 of the tenon. Similar changes were observed in half tenon joints and dovetail joints. As the tenon pulled out of the mortise, the bearing capacity of mortise and tenon joints decreased. Figure 10 shows the hysteresis curves of through, half and dovetail tenon joints with no gap between mortise and tenon shoulder. In general, the peak values of through-tenon joint were the biggest, which was about 1.6 and 5.6 times of dovetail mortise and tenon joint in positive and negative directions, respectively. Peak values of half tenon joint were the smallest, which were about 45% and 11% of the through-tenon joint. This was mainly because the tenon length of through-tenon joint was the longest, and the contact area of through-tenon and mortise was the biggest. The length of half tenon and dovetail tenon were the same. However, the tenon of the dovetail joint was inserted into the internal joint of the dowel. The dovetail-shaped rabbet restricts the movement of the dovetail tenon.
Skeleton Curves
The skeleton curve can reflect the relationship between force and deformation, and the corresponding skeleton curve is obtained according to the force-displacement hysteresis curves. Skeleton curves of three types of mortise and tenon joints are shown in Fig. 11. For all the types of mortise-tenon joints, the curve values decreased with the increase of the initial length that tenon pulls out of the mortise. The bending moments of joints decreases with the increase of the initial length that tenon pulls out of mortise.
The force-displacement skeleton curves of three types of mortise-tenon joint types show an increasing trend while the loading displacements increase. The slopes of curves increased with the loading displacements. Thus, the mortise-tenon joints exhibited good load bearing and rotational ability. In the early stage of loading, the forces grew slowly. The forces increased while the loading displacements increased. This can be explained as follows: there were gaps between the surfaces of tenon and mortise because all specimens were handmade. When the loading displacements were small, the tenon slid in the mortise. When the loading displacements were greater than 10 mm, the tenon and mortise were squeezed together. The bigger loading displacements resulted in a tighter squeeze, leading to greater bearing capacity.

Fig. 11. Skeleton curves of load-displacement: (a) Through-tenon joint; (b) Half tenon joint; (c) Dovetail tenon joint
Figure 12 shows the skeleton curves of T00, H00, and D00, with no gaps between mortise and tenon shoulder. The curve values and slopes of through-tenon joints were the biggest, dovetail tenon joint was smaller, and half tenon joint was the smallest. This indicates bearing capacity and stiffness of through-tenon joints were the biggest, dovetail tenon joint was smaller, and half tenon joint was the smallest. Capacity and stiffness of mortise tenon joint are related to the length and shape of the tenon.
Figure 13 shows the relationship between the length that a tenon pulls out of the mortise and the rotation angle during the loading process. During the loading process, the tenon slid in the mortise while the loading displacement increased and decreased. In general, the bigger rotation angles, the longer that tenon pulls out of mortise. At the same rotation angle, the bigger initial gaps between mortise and tenon shoulder, the further that tenon pulls out of the mortise.

Rigidity Degradation
During the loading process, the stiffness of structure decreased with the increase of loading cycle times. The stiffness of the tenon and mortise joints can be calculated and expressed by tangent stiffness. The tangent stiffness was calculated as follows,
 (1)
(1)
where ±Fi is the peak values of hysteresis curves in positive and negative directions of the first cycle of loading level i, whereas ±∆ are the corresponding peak displacements in loading level i. The stiffness values Ki of every loading level can be calculated by formula (1). The stiffness degradation curve is the connection of Ki. The stiffness degradation curves of three types of mortise and tenon joints are shown in Fig. 14.

Fig. 14. Stiffness degradation curves of three types of mortise and tenon joints: (a) Through-tenon joint; (b) Half tenon joint; (c) Dovetail tenon joint
When the loading displacements were small (±1~±10 mm), the stiffness of all three types of mortise-tenon joints decreased rapidly with the increase of loading displacements. When the loading displacement exceeded 10 mm, the stiffness of the structure tended to stabilize, and a slight increase was observed. This phenomenon may be explained by the following reasons: at the initial stage of loading, the displacement is small and the force is relatively low. At this point, there is no relative sliding between tenon and mortise, resulting in a higher stiffness. As the loading displacements increases, the forces also increase gradually. Due to the presence of gaps between the surfaces of mortise and tenon, relative sliding occurs between them, leading to a sharp decrease in stiffness. When the loading displacement exceeds 10 mm, the mortise and tenon are tightly compressed against each other, resulting in elastic-plastic deformation and a strengthening effect. This leads to a slight increase in stiffness.
The initial length of tenon unthread mortise has the same impact on the stiffness degradation of the three types of mortise and tenon joints. Under the same level of loading displacement, the greater the initial length of unthreading, the lower the stiffness of the joint. This mainly because the longer tenon unthread mortise, the smaller contact areas between mortise and tenon.

Fig. 15. Stiffness degradation curves of three types of mortise-tenon joints with no length of tenon pulls out of the mortise
Figure 15 shows that the stiffness of three types of mortise-tenon joints had a decreasing trend while the loading displacements increased. The stiffness of the through-tenon joint was the biggest, the dovetail tenon joint was smaller, and the half tenon joint was the smallest. This mainly was because the length of tenon and contact areas of through-tenon joint were the longest and largest. The dovetailed tenon is stuck inside the dovetailed mortise, restricting the sliding of the tenon. Although, the length of half tenon and dovetail tenon were the same, the stiffness of dovetail tenon joint was slightly bigger than half tenon joint.
Energy-Dissipation Capacity
The energy dissipation capacity of the mortise-tenon joints can be evaluated by areas of hysteresis curves in the first loading cycle. The larger the area of the hysteresis loop, the more seismic energy is dissipated. The hysteresis curves’ areas of three types of mortise and tenon joints with different gaps between mortise and tenon shoulder at different loading levels were calculated, as shown in Fig. 16.
Figure 16 shows the bigger and larger loading displacements and rotation angle, the more seismic energy was dissipated. All of the curves show a parabolic growth trend. For all types of mortise and tenon joints, the gaps between tenon shoulder and mortise decreased the energy dissipation capacities of the joints. The further that a tenon was pulled out of a mortise, the weaker the energy consumption capacity.
Energy consumption capacity of three types of mortise and tenon joints without gaps between mortise and tenon shoulder were compared, as shown in Fig. 17. The energy consumption capacity of through-tenon joint was biggest, dovetail tenon joint was weaker, and half tenon joint was weakest. This indicates that the tenon size and shape have dramatic influence on seismic properties.

Fig. 16. Areas of hysteresis curves: (a) Through-tenon joint; (b) Half tenon joint; (c) Dovetail tenon joint

Fig. 17. Hysteresis curves’ areas of three types of joints with no gaps between mortise and tenon shoulder
CONCLUSIONS
- During the loading process of all types of mortise and tenon joints, when the loading displacements were below 10 mm, no evidence of damage was found. When the loading displacements were beyond 20 mm, the mortise and tenon began to squeeze tighter and tighter and made creaking sounds. After loading, there were residual gaps between tenon shoulder and mortise, and the further that the initial length of the tenon pulled out of the mortise, the bigger gaps residual gaps between tenon shoulder and mortise. Plastic deformation and cracks of mortise and tenon joints were observed after testing.
- The force-displacement hysteresis curves of all types of mortise and tenon joints were “Z” shaped. The pinching effect was more obvious with increasing loading displacements and loading cycle times. At the same level of loading displacement, the areas of the hysteresis loops, reflecting the energy dissipation capacities of joints, were decreased with the increase of initial gaps between mortise and tenon shoulder. The areas of the hysteresis loops of every test increased with the increasing of loading displacement. This means that the larger the rotational angle and loading displacements, the more energy is dissipated.
- At the same loading level, the load bearing capacities, stiffness, and energy dissipation capacities of all joints were decreased with the increase of initial length that a tenon pulled out of the mortise. When the loading displacements were below 10 mm, the stiffness of joints decreased rapidly. However, when the loading displacements were beyond 10 mm, the mortise and tenon squeezed tighter and tighter, and the stiffness of the joint tended to stabilize and a slight increase was observed.
- Compared with the other two types of joints when there were no gaps between mortise and tenon shoulder, the joint bearing capacity, stiffness, and energy dissipation capacity of the through-tenon joint were biggest, the dovetail tenon joint came second, and the half tenon joint was the smallest. However, all three types of joints exhibited good deformation capacity, torsional capacity, and load capacity, which can help improve the seismic performance and durability of the structure.
ACKNOWLEDGMENTS
The authors are grateful for financial support from the Beijing Municipal Commission of Education-Municipal Natural Science Joint Foundation: “Research on Seismic Performance Evaluation of Beijing Ancient Timber Buildings Based on Value and damage Characteristics” (Grant No. KZ202010005012); the National Natural Science Foundation of China (Grant No. 52278472); Beijing Municipal Natural Science Foundation (Grant No.8232004).
REFERENCES CITED
Aejaz, S. A., Dar, M. A., Dar, A. R., Bhat, J. A., and Carvalho, H. (2021). “Behaviour of various framed timber joints: Capacity and improved design rules,” Journal of Building Engineering 44, article 103417. DOI: 10.1016/j.jobe.2021.103417
Ali, Q., Schacher, T., Ashraf, M., Alam, B., Naeem, A., Ahmad, N., and Umar, M. (2012). “In-plane behavior of the Dhajji-Dewari structural system (wooden braced frame with masonry infill),” Earthquake Spectra 28(3), 835-858. DOI: 10.1193/1.4000051
Ali, Q., Ahmad, N., Ashraf, M., and Schacher, T. (2022). “Seismic performance evaluation of two-story Dhajji-dewari traditional structure,” International Journal of Architectural Heritage 16(8), 1233-1251. DOI: 10.1080/15583058.2021.1875081
Bai, J. F., and Ma, L. L. (2018). “A seismic design philosophy of Chinese ancient wooden structure,” Building Structures 48(S2), 260-263. DOI: CNKI:SUN:JCJG.0.2018-S2-053.
Chang, W. S., Hsu, M. F., and Chen, C. J. (2004). “Estimating rotational stiffness of timber joints by using fractional factorial experiments combined with computer simulation,” in: Proceeding of the 8th World Conference on Timber Engineering Conference (WCTE), Lahti, Finland.
Chen, C. C., Qiu, H. X., and Lu, Y. (2016a). “Flexural behaviour of timber dovetail mortise–tenon joints,” Construction and Building Materials 112, 366-377. DOI:10.1016/j.conbuildmat.2016.02.074.
Chen, J. Y., Shi, X. W., Niu, Q. F., Wei, J. W., Li, T. Y., and Zhao, Y. X. (2016b). “Analysis of similar CaiFen modular system based on the weight of the roof of Song dynasty,” J. Civ. Archit. Environ. Eng. 38, 27-33. DOI:10.11835/j.issn.1674-4764.2016.05.004.
Chen, Z., Zhu, E., Pan, J., and Wu, G. (2016c). “Energy-dissipation performance of typical beam-column joints in Yingxian wood pagoda: Experimental study,” Journal of Performance of Constructed Facilities 30(3). DOI: 10.1061/(asce)cf.1943-5509.0000771.
Crayssac, E., Song, X., Wu, Y., and Li, K. (2018). “Lateral performance of mortise-tenon jointed traditional timber frames with wood panel infill,” Engineering Structures 161, 223-230. DOI: 10.1016/j.engstruct.2018.02.022
Dutu, A., Sakata, H., Yamazaki, Y., and Shindo, T. (2016). “In-plane behavior of timber frames with masonry infills under static cyclic loading,” Journal of Structural Engineering 142(2), article 04015140. DOI:10.1061/(asce)st.1943-541x.0001405
Fang, D. P., Yu, M. H., and Miyamoto, Y. (2000). “Experimental studies on structural characteristics of ancient timber architectures,” Engineering Mechanics 17(2), 75-83. DOI: 10.3969/j.issn.1000-4750.2000.02.011.
Fang, D. P., Iwasaki, S., Yu, M. H., Shen, Q. P., Miyamoto, Y., and Hikosaka, H. (2001). “Ancient Chinese timber architecture. I: Experimental study,” Journal of Structural Engineering 127(11), 1348-1357. DOI: 10.1061/(asce)0733-9445(2001)127:11(1348)
GB 1927-1943 (1992). “Physical and mechanical methods of wood,” China Standards Press, Beijing, China.
GB/T50165 (2020). “Technical standards for the maintenance and reinforcement of wooden structures in ancient buildings,” Beijing, China Architecture and Building Press.
Hu, W. G., Guan, H. Y., and Zhang, J. L. (2018). “Finite element analysis of tensile load resistance of mortise-and-tenon joints considering tenon fit effects,” Wood and Fiber Science 50, 121-131. DOI:10.22382/wfs-2018-014
Huan, J. H., Ma, D. H., Guo, X. D., and Xu, S. (2019). “Experimental study of aseismic behaviors of flexural tenon joint, through tenon joint and dovetail joint reinforced with flat steel devices,” Journal of Beijing University of Technology 45(08), 763-771. DOI: 10.11936/bjutxb2018010012
Huan, J., Guo, X., Guan, Z., Yan, T., Chu, T., and Sun, Z. (2022). “An experimental study of the hysteresis model of the Kanchuang frame used in Chinese traditional timber buildings of the Qing dynasty,” Buildings 12(7), article 887. DOI: 10.3390/buildings12070887
ISO 16670 (2003). “Timber structure-Joints made with mechanical fasters-Quasi-static reversed cyclic test method,” International Organization for Standard.
ISO FDIS 21581 (2010). “Timber structures—Static and cyclic lateral load test methods for shear walls,” China Standards Press, Beijing, China.
King, W. S., Yen, J. Y. R., and Yen, Y. N. A. (1996). “Joint characteristics of traditional Chinese wooden frames,” Engineering Structures 18, 635-644. DOI: 10.1016/0141-0296(96)00203-9
Kline, S. J. (1965). Similitude and Approximation Theory, Mc Graw-Hill, New York, USA.
Shields, L. D., and Hindman, D. P. (2015). “Evaluation of keyed-through tenon joints for timber frame construction,” Practice Periodical on Structural Design and Construction 20(4), article 4014045.1-6. DOI: 10.1061/(ASCE)SC.1943-5576.0000232
Li, J. (1950). Yingzao Fashi (Construction Method), Kaifeng, Royal Press.
Liang, S. C. (2005). History of Chinese Architecture, Baihua Literary and Art Press Tianjin, China.
Liang, Ssu-Ch’eng (edited by Wilma Fairbank). (1984). A Pictorial History of Chinese Architecture, Boston, MTT Press.
Liu, D. K. (2001a). “Roof loads of Chinese timber buildings (first volume),” Tradit. Chin. Archit. Gard. 2001(3), 58-64.
Liu, D. K. (2001b). “Roof loads of Chinese timber buildings (second volume),” Tradit. Chin. Archit. Gard. 2001(4), 56-63.
Ma, B. J. (1991). Wood Construction Technology for Ancient Chinese Buildings, Science Press, Beijing, China.
Parisi, M. A., and Piazza, M. (2000). “Mechanics of plain and retrofitted traditional timber connection,” Journal of Structural Engineering 126(12), 1395-1403. DOI: 10.1061/(ASCE)0733-9445(2000)126:12(1395)
Sabnis, G. M., and Harris, H. G. (1983). Structural Modeling and Experimental Techniques, Prentice-Hall, Englewood Cliffs, NJ, USA.
Sha, B., Xie, L. L., Yong, X. Q., and Li, A. Q. (2021). “Hysteretic behavior of an ancient Chinese multi-layer timber substructure: A full-scale experimental test and analytical model,” Journal of Building Engineering 43, 1-11. DOI: 10.1016/j.jobe.2021.103163
Shanks, J. and Walker, P. (2009). “Strength and stiffness of all-timber pegged connections,” Journal of Materials in Civil Engineering 21(1), 10-18. DOI: 10.1061/(ASCE)0899-1561(2009)21:1(10)
Shanks, J. D., Chang, W. S., and Komatsu K. (2008). “Experimental study on mechanical performance of all-softwood pegged mortice and tenon connections,” Biosystems Engineering 100(4), 562-570. DOI: 10.1016/j.biosystemseng.2008.03.012
Shi, X. W., Chen, Y. F., Chen, J. Y., Yang Q. S., and Li., T. Y. (2018). “Experimental assessment on the hysteretic behavior of a full-scale traditional Chinese timber structure using a synchronous loading technique,” Advances in Materials Science and Engineering 2018, 1-16. DOI: 10.1155/2018/5729198
Sun, B. (2011). “Results of the Third National Cultural Heritage Census officially released to the public,” China Cultural Relics News, 2011-12-30(001).
Vieux-Champagne, F., Sieffert, Y., Grange, S., Polastri, A., Ceccotti, A., and Daudeville, L. (2014). “Experimental analysis of seismic resistance of timber-framed structures with stones and earth infill,” Engineering Structures 69, 102-115. DOI: 10.1016/j.engstruct.2014.02.020
Wang, L., Xu, W., and Wang J. A. (2003). “The saptio-temporal pattern of historical earthquake disaster in China,” Journal of Beijing Normal University (Natural Science) (04), 544-550.
Wu, G. F., Zhong, Y., Gong, Y. C., and Ren, H. Q. (2019). “Review of performance of tenon-mortise joints between column and beam in timber structures,” China Wood Industry 33(5), 25-29. DOI: 10.19455/j.mcgy.20190506.
Wu, Y. J., Song, X. B., and Li, K. (2018). “Compressive and racking performance of eccentrically aligned dou-gong connections,” Engineering Structures 175, 743-752. DOI: 10.1016/j.engstruct.2018.08.054
Xie, Q., Zhang, L., Wang, L., Zhou, W., and Zhou, T. G. (2019). “Lateral performance of traditional Chinese timber frames: Experiments and analytical model,” Engineering Structures 186, 446-455. DOI: 10.1016/j.engstruct.2019.02.038
Xu, Y. (2006). Wood Science, China Forestry Publishing House, Beijing, China.
Xue, J. Y., Li, Y. Z., Xia, H. L., and Sui, Y. (2016). “Experimental study on seismic performance of dovetail joints with different loose degrees in ancient buildings,” Journal of Building Structures 37(4), 73-79. DOI: 10.14006/j.jzjgxb.2016.04.010
Xue, J. Y, Xia, H. L., Li, Y. Z., and Dai, W. Q. (2017). “Experimental study on seismic behavior of penetrated mortise-tenon joints under different degree of looseness in ancient buildings,” Journal of Xian University of Architecture & Technology (Natural Science Edition) 49(4), 463-469, 477. DOI: 10.15986/j.1006-7930.2017.04.001
Yang, Y. D., Du, J. L, and Li, G. R. (2000). “Analysis of the earthquake disaster characteristics of ancient building structures,” World Information on Earthquake Engineering 16(3), 12-16.
Yeo, S. Y., Hsu, M.-F., Komatsu, K., Chung, Y.-L., and Chang, W.-S. (2016). “Shaking table test of the Taiwanese traditional Dieh-Dou timber frame,” International Journal of Architectural Heritage 10, 539-557. DOI:10.1080/15583058.2015.1009574
Zhi, Y. (2014). “Traditional Chinese wood structure joints with an experiment considering regional differences,” International Journal of Architectural Heritage 8, 224-246. DOI:10.1080/15583058.2012.688179
Zhao, H. T., Xue, J. Y., Sui, Y., and Xie, Q. F. (2012). “Ancient Chinese architectural structures and their seismic resistance: Experiments,” Theories and Reinforcement Methods, Science Press, Beijing, China.
Zhou, Y., and Lv, X. L. (2016). Method and Technology for Shaking Table Model Test of Building Structures, Science Press, Beijing, China.
Zhou, Q., and Yang, N. (2017). “Typical structural health problems of tenon-mortise joints of ancient buildings in the Forbidden City,” Journal of Water Resources and Architectural Engineering 15(05). DOI: 10.3969/j.issn.1672-1144.2017.05.003
Article submitted: September 28, 2023; Peer review completed: November 4, 2023; Revised version received and accepted: November 13, 2023; Published: November 21, 2023.
DOI: 10.15376/biores.19.1.478-499