
Abstract
This study aimed to develop a simple measuring method to determine Young’s modulus of a wooden bar by measuring its flexural vibration without measuring its weight. Before and after bonding an iron piece to a wooden rectangular bar, a free-free flexural vibration test and fixed-fixed flexural vibration test were performed to obtain Young’s modulus. Young’s modulus was calculated by substituting the ratio of the resonance frequencies of a wooden bar with and without a bonded iron piece into the frequency equation. The calculated results resembled the experimental values determined without the iron piece.
Download PDF
Full Article
Measuring Young’s Modulus of a Wooden Bar Using Flexural Vibration without Measuring its Weight
Yoshitaka Kubojima,a,* Hideo Kato,b Mario Tonosaki,c and Satomi Sonoda d
This study aimed to develop a simple measuring method to determine Young’s modulus of a wooden bar by measuring its flexural vibration without measuring its weight. Before and after bonding an iron piece to a wooden rectangular bar, a free-free flexural vibration test and fixed-fixed flexural vibration test were performed to obtain Young’s modulus. Young’s modulus was calculated by substituting the ratio of the resonance frequencies of a wooden bar with and without a bonded iron piece into the frequency equation. The calculated results resembled the experimental values determined without the iron piece.
Keywords: Additional mass; Flexural vibration; Measuring weight; Wooden bar; Young’s modulus
Contact information: a: Department of Wood Properties, Forestry and Forest Products Research Institute, 1 Matsunosato, Tsukuba, Ibaraki, 305-8687 Japan; b: Department of Wood Engineering, Forestry and Forest Products Research Institute, 1 Matsunosato, Tsukuba, Ibaraki, 305-8687 Japan; c: Shikoku Research Center, Forestry and Forest Products Research Institute, 2-195 Asakura Nishimachi, Kochi, Kochi, 780-8077 Japan; d: Toyama Prefectural Agricultural, Forestry & Fisheries Research Center; 4940 Kurokawa Shin, Imizu, Toyama; *Corresponding author: kubojima@ffpri.affrc.go.jp
INTRODUCTION
On the basis of the theory of flexural and longitudinal vibrations, the authors previously investigated the influence of inhomogeneity of density that was realized by bonding an iron piece to a wooden bar on Young’s modulus of the wooden bar. It was shown that values for Young’s moduli with an iron piece resembled values without the iron piece when calculated using the developed frequency equation, incorporating the effects of additional mass and its position (Kubojima et al. 2003, 2005, 2014). In addition, the degree and position of the inhomogeneity of density could be estimated by the relationship between Young’s modulus and resonance mode number for the flexural vibration. The inhomogeneity of density that affected the Young’s modulus was thought to be caused by a high density part because of indented rings, knots, or resin (Kubojima et al. 2006b).
For the longitudinal vibration, the Young’s modulus could be obtained without measuring the weight of a bar using the developed equation (Kubojima and Sonoda 2015); hence it is possible that the Young’s modulus for piled lumber could be obtained very simply; this method is called “the vibration method with additional mass” in this study.
For the flexural vibration, if a measuring method to obtain the Young’s modulus without measuring the weight of a bar exists, it will be applicable to various cases. For example, the 100% inspection of the deterioration of beams for timber guardrails can be considered. Measuring strength properties, for example, the Young’s modulus of a beam fixed to a post of a guardrail is required to perform the inspection simply in a short time. Moreover, such a method will be also valuable for obtaining the Young’s modulus of a beam used for wooden houses and buildings. Measuring Young’s modulus of the timber built into structures without knowing the timber density is required and a method using only the stress wave propagation velocity has been proposed. This method is based on a database of wood strength performance and density accumulated from a variety of research data (Yamasaki and Sasaki 2010; Yamasaki et al. 2010).
The objective of this paper was to develop the vibration method with additional mass for the flexural vibration using small and clear specimens. A wooden bar with free ends was used as the simplest end condition among various end conditions to perform the flexural vibration test. Based on the results of the bar with free ends, the vibration method with additional mass for the flexural vibration was applied to the fixed ends condition that can represent the timber used for actual structures rather than the free ends condition.
PROCEDURE OF CALCULATING YOUNG’S MODULUS BY VIBRATION METHOD WITH ADDITIONAL MASS
A thin beam is considered. In this case, the effect of shear deflection and rotary inertia involved in the flexural vibrational deflection are negligible and the Euler-Bernoulli’s elementary theory of bending can be applied to the vibration. According to Euler-Bernoulli’s theory, the differential equation for the bending of a bar is Eq. 1,
![]() (1)
(1)
where E, I, x, y, p, A, t are Young’s modulus, the moment of inertia of cross section, distance along the bar, lateral displacement, density, cross-sectional area, and time, respectively.
Solving Eq. 1, y is given by Eq. 2,
![]() (2)
(2)
where C1 – C4 are constants, n is the resonance mode number, and is calculated according to Eq. 3,
![]() (3)
(3)
where is the angular frequency. Then, Young’s modulus is Eq. 4,
![]() (4)
(4)
where (l is length under free ends condition and span under fixed ends condition).
The concentrated mass M is placed at x1 = al and x2 = 0 (Fig. 1).
Since neither bending moment nor shearing force exists at either end under the free ends condition, Eq. 5a can be obtained:
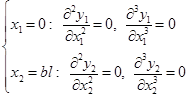 (5a)
(5a)
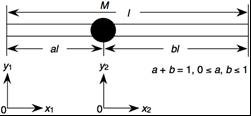
Fig. 1. A beam with additional mass
Since the deflection and slope of the deflection curve are equal to zero under the fixed ends condition, Eq. 5b can be obtained:
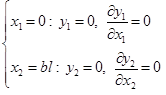 (5b)
(5b)
Since both parts of the beam are connected and the difference of shearing force is equal to the inertia force at x1 = al and x2 = 0,
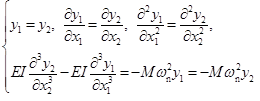 (6)
(6)
Using Eqs. 2 – 4, 5a, 5b and 6, Eqs. 7a and 7b can be obtained: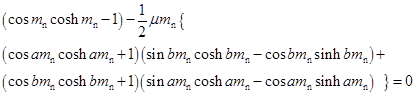 (for free ends) (7a)
(Kubojima et al. 2005) and 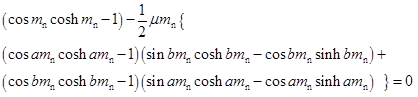 (for fixed ends), (7b)
where u is the ratio of the concentrated mass to the mass of the bar and is written as Eq. 8:
![]() (8)
(8)
If u = 0 is applied to Eqs. 7a and 7b, they result in Eq. 9,
![]() (9)
(9)
where the suffix 0 represents the measurement without a concentrated mass.
From Eq. 9, mn0 is written as Eq. 10,
![]() (10)
(10)
For a bar without a concentrated mass, Young’s modulus is expressed by Eq. 11,
![]() (11)
(11)
Using Eqs. 4 and 11, mn can be expressed by Eq. 12,
 (12)
(12)
Here, mn and fn in Eq. 12 are the values with a concentrated mass.
Resonance frequencies fn and fn0 are obtained by the vibration test. The value of u was calculated by substituting mn from Eq. 12 into Eqs. 7a and 7b. The density was obtained by substituting the calculated values for u, the concentrated mass, and dimensions of a bar into Eq. 8. The Young’s modulus was then calculated using the calculated density, dimensions, and resonance frequency without a concentrated mass from Eq. 11.
EXPERIMENTAL
Materials
Sitka spruce (Picea sitchensis Carr.) and Sakhalin spruce (Picea glehnii Mast.) specimens, 300 mm long (longitudinal, L), 25 or 30 mm wide (radial, R), and 5 mm thick (tangential, T) were conditioned at 20 °C and 65% relative humidity until the weight was constant. They were small and clear specimens. All tests were conducted under the same conditions.
Free-Free Flexural Vibration Test
To obtain the Young’s modulus by bending, free-free flexural vibration tests were conducted according to the following procedure (Kubojima et al. 2005). The test bar was suspended by two threads at the nodal positions of free-free vibration corresponding to its resonance mode (0.2242l and 0.7758l for the 1st mode, 0.1321l and 0.8679l for the 2nd mode, 0.0944l and 0.9056l for the 3rd mode, 0.2768l and 0.7232l for the 4th mode, 0.2265l and 0.7735l for the 5th mode) and then excited in the direction of thickness at one end using a wooden hammer, while bar motion was detected by a microphone at the other end. The signal was processed through a fast Fourier transform (FFT) digital signal analyzer (Multi-Purpose FFT Analyzer CF-5220, Ono Sokki Co., Ltd, Yokohama, Japan) to yield high-resolution resonance frequencies (Fig. 2).
The vibration test was conducted for the specimen with and without iron pieces (1: 0.64 g, 2: 1.29 g, 3: 1.90 g) and the resonance frequencies of the first to fifth modes were measured. The iron piece was bonded at x = 0, 0.1l, 0.2l, 0.3l, 0.4l, and 0.5l on the LR-plane with two-sided adhesive tape. So, the same specimen could be used by bonding an iron piece at six positions of the bar.
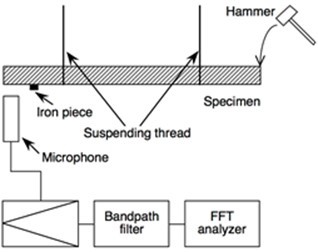
Fig. 2. A diagram of the experimental setup for free-free flexural vibration test
Fixed-Fixed Flexural Vibration Test
To obtain the Young’s modulus by bending, flexural vibration tests were conducted by the following procedure (Kubojima et al. 2006a). An apparatus (End condition controller KS-200, Takachihoseiki Co., Ltd., Tokyo, Japan) shown in Fig. 3 was used to provide various end conditions.
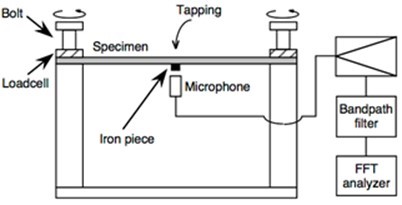
Fig. 3. Schematic diagram of the vibration test under various end conditions
The regions of 25 mm (L) × 25 mm (R) from both ends were clamped by the posts of the apparatus whose cross section was 25 mm × 25 mm. The test bar was compressed by screwing a bolt attached to a load cell. The compressing load was measured by the load cell and recorded by a data logger. The vibration was excited in the direction of the thickness at its center part by a hammer. The motion of the bar was detected by a microphone in the center part. The signal was processed through the FFT digital signal analyzer mentioned above to yield high-resolution resonance frequencies.
The vibration test was conducted for the specimen with and without the above mentioned iron pieces 1 to 3, and the resonance frequency of the first mode was measured. One of the future possible use of the flexural vibration method with additional mass is the inspection of the deterioration of a beam for a timber guardrail, in other words, measuring the Young’s modulus of a beam fixed to a post of a guardrail. In this case, an iron piece will be bonded at x = 0.5l. Hence, the iron piece was bonded at x = 0.5l on the LR-plane with two-sided adhesive tape.
RESULTS AND DISCUSSION
To examine whether or not the developed method was applicable to an ideal experimental condition, representative examples were considered. The density and the Young’s modulus EAM by the vibration method with additional mass developed in this paper (suffix “AM”: additional mass) were compared with the density and the Young’s modulus E0 of the specimen without the concentrated mass, respectively. The density was obtained using the dimensions and weight of the specimen while the Young’s modulus E0 was obtained using and the measured resonance frequency.
Free-Free Flexural Vibration
Table 1 shows a representative example of the ratio of the Young’s modulus of the bar with the concentrated mass to that without the concentrated mass EAM/E0.
Table 1. The Ratio of the Young’s Modulus of the Bar with the Concentrated Mass to that without the Concentrated Mass
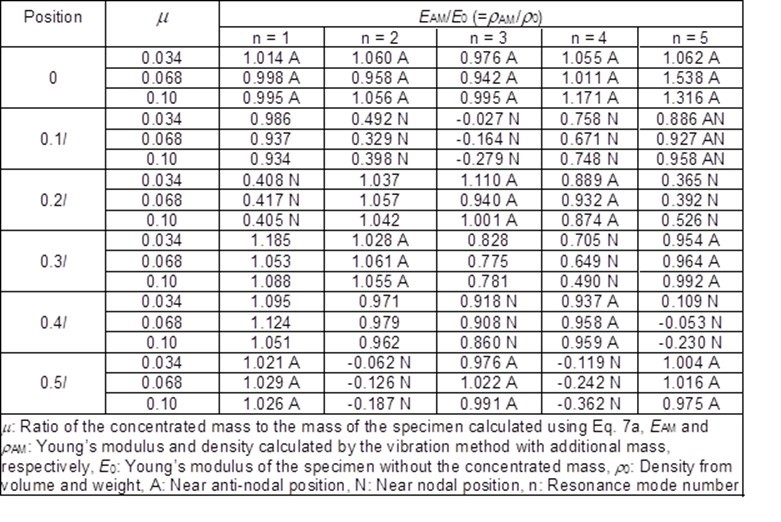
The density and Young’s modulus E0 of the specimen without the concentrated mass were 418 kg/m3, 11.28 GPa (n = 1), 11.15 GPa (n = 2), 10.86 GPa (n = 3), 10.49 GPa (n = 4), and 10.21 GPa (n = 5), respectively. The values of u for the iron pieces 1 through 3 were 0.034, 0.068, and 0.10, respectively.
Roughly speaking, when the positions of the concentrated mass were near anti-nodal and nodal positions, EAM/E0 was close to and quite different from 1, respectively. The “near” nodal and anti-nodal positions were determined as follows: to express the “near” nodal and anti-nodal positions, distance between the position of the concentrated mass and the nodal position dN and that between the position of the concentrated mass and the anti-nodal position dA were considered. The values of dN and dA were expressed by Eqs. 13 and 14,
![]() (13)
(13)
![]() (14)
(14)
where xCM, xN, and xA represent the position of the concentrated mass, nodal position, and anti-nodal position, respectively. The nodal and anti-nodal positions of the flexural vibration under free-free conditions are shown in Table 2. When the minimums of dN and dA shown in Table 3 were equal to or less than 0.05l, such positions of the concentrated mass were “near” nodal and anti-nodal positions, respectively, in this paper. For example, when the concentrated mass was bonded at x = 0.2l and the resonance mode number was 5, dN is expressed by Eq. 15,
![]() (15)
(15)
Table 2. Nodal and Anti-Nodal Positions of Free-Free Flexural Vibration
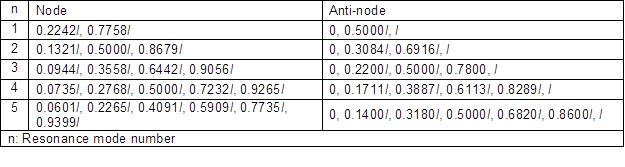
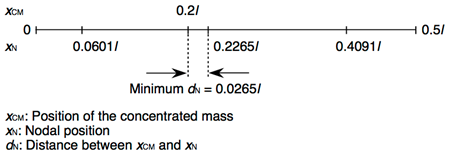
Fig. 4. An example of “near” nodal position (5th mode)
Table 3. Minimum of the Distance between the Position of Concentrated Mass and Nodal Position and Minimum of the Distance between the Position of Concentrated Mass and Anti-Nodal Position
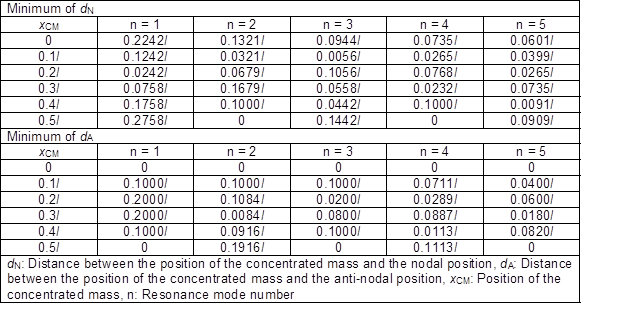
Since the minimum dN was 0.0265l, the position of x = 0.2l was near nodal position for n = 5 in this paper (Fig. 4). When the concentrated mass was at x = 0.1l and the resonance mode number was 5, the minimums of dN and dA were 0.0399l and 0.04l, respectively. Hence, the position of x = 0.1l was near nodal and anti-nodal positions for n = 5 in this paper.
This tendency can be explained by the relationship between mn and m calculated using Eq. 7a. Figure 5 shows the relationship between m1 and m as an example. The larger absolute value of the differential coefficient of the m1–m relationship is suitable because the effect of any errors in mn caused by measuring the resonance frequency on m can be ignored.
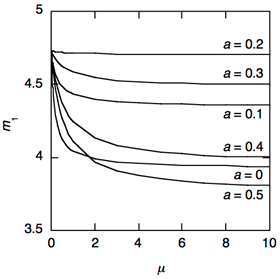
Fig. 5. The relationship between m1 and m calculated using Eq. 7a (free ends condition)
Although it is possible to obtain the accurate Young’s modulus in a case of the smaller absolute value of the differential coefficient of the m1-u relationship, for example, in a case of the larger concentrated mass, it will be difficult to obtain the accurate Young’s modulus. From Fig. 5, the absolute values of the differential coefficient of the m1-u relationship of the bar with the concentrated mass bonded near the anti-nodal positions (0 and 0.5l) were larger than those of the bar with the concentrated mass bonded near the nodal positions (0.2l).
It is thought that EAM was reasonable in the case of 0.95 £ EAM/E0 £ 1.05. When the position of the concentrated mass was near anti-nodal position, more than half of EAM were reasonable. Therefore, the developed measuring method in this study was effective to obtain the accurate Young’s modulus without measuring the weight of the bar.
Fixed-Fixed Flexural Vibration
The results of the free-free flexural vibration suggested that the vibration method with additional mass was effective when the concentrated mass was bonded around anti-nodal positions. Hence, the first resonance mode of the bar with the concentrated mass bonded at x = 0.5l was investigated. The resonance frequencies of the bar with the concentrated mass were measured when the resonance frequency was stable, as shown in Fig. 6. Compression stresses at ends of the specimens were about 2600 kPa. Figure 7 shows the relationship between m1 and m calculated using Eq. 7b. This was similar tendency to that under free ends conditions (Fig. 5): the absolute value of the differential coefficient of the m1–m relationship decreased with the increase in u.
The following is a representative example of the results. The density and Young’s modulus E0 without the iron piece were 432 kg/m3 and 9.04 GPa, respectively. The values of u for the iron pieces 1 through 3 were 0.046, 0.093, and 0.137, respectively. The ratios of the bar with the concentrated mass to that without the concentrated mass EAM/E0 were 1.062 (u= 0.046), 1.071 (u= 0.093), and 1.069 (u= 0.137). These results were not within the range of 0.95 £ EAM/E0 £ 1.05 mentioned above. We think that this is attributed to the fact that realizing the perfect fixed-fixed condition is very difficult (Kubojima et al. 2006a). Therefore, it was concluded that the appropriate Young’s modulus was obtained by the vibration method with additional mass under fixed ends condition.
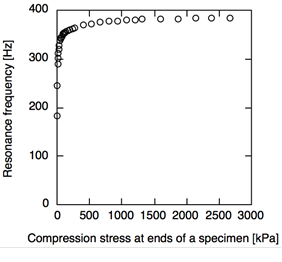
Fig. 6. Change in resonance frequency with compression
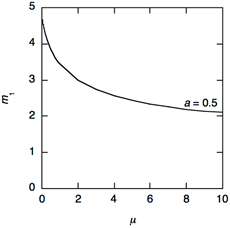
Fig. 7. The relationship between m1 and m calculated using Eq. 7b (Fixed ends condition)
CONCLUSIONS
- A frequency equation of flexural vibration incorporating the effects of additional mass and its position under fixed-fixed condition was developed.
- The Young’s moduli by the developed flexural vibration method with additional mass under free-free and fixed-fixed conditions were close to the experimental value without a concentrated mass. These results mean that the appropriate Young’s modulus can be obtained by the vibration method with additional mass for the flexural vibration.
- The larger absolute values of the differential coefficient of the m1-u relationship, for example, bonding the smaller concentrated at the anti-nodal positions, is suitable to obtain the accurate Young’s modulus because the effect of any errors in m1 caused by measuring the resonance frequency on u can be ignored.
ACKNOWLEDGMENTS
The authors are grateful for the support of the Research grant #201402 of the Forestry and Forest Products Research Institute. This study was presented in part at the 32th Annual Meeting of Wood Technological Association of Japan, Akita, October 2014.
REFERENCES CITED
Kubojima, Y., Tonosaki, M., and Yoshihara, H. (2003). “Effect of the additional mass applied at an end of a wooden beam on its flexural vibrational properties,” Wood Ind. 58(8), 370-372.
Kubojima, Y., Tonosaki, M., and Yoshihara, H. (2005). “Effect of additional mass on Young’s modulus of a wooden beam,” J. Test. Eval. 33(4), 278-282.
Kubojima, Y., Ohsaki, H., Kato, H., and Tonosaki, M. (2006a). “Fixed-fixed flexural vibration testing method of beams for timber guardrails,” J. Wood Sci. 52(3), 202-207. DOI: 10.1007/s10086-005-0754-3
Kubojima, Y., Yoshihara, H., and Tonosaki, M. (2006b). “Young’s modulus of a wooden beam with inhomogeneity of density obtained by flexural vibration test,” J. Wood. Sci. 52(1), 20-24. DOI: 10.1007/s10086-005-0732-9
Kubojima, Y., Suzuki, Y., and Tonosaki, M. (2014). “Effect of additional mass on the apparent Young’s modulus of a wooden bar by longitudinal vibration,” BioResources 9(3), 5088-5098.
Kubojima, Y., and Sonoda, S. (2015). “Measuring Young’s modulus of a wooden bar using longitudinal vibration without measuring its weight,” Euro. J. Wood Wood Prod. 73(3), 399-401. DOI: 10.1007/s00107-015-0884-2
Yamasaki, M., and Sasaki, Y. (2010). “Determining Young’s modulus of timber on the basis of a strength database and stress wave propagation velocity I: an estimation method for Young’s modulus employing Monte Carlo simulation,” J. Wood Sci. 56(4), 269-275. DOI: 10.1007/s10086-010-1108-3
Yamasaki, M., Sasaki, Y., and Iijima, Y. (2010). “Determining Young’s modulus of timber on the basis of a strength database and stress wave propagation velocity II: effect of the reference distribution database on the determination,” J. Wood Sci. 56(5), 380-386. DOI: 10.1007/s10086-010-1114-5
Article submitted: July 17, 2015; Peer review completed: November 1, 2015; Revised version received: November 3, 2015; Accepted: November 7, 2015; Published: November 30, 2015.
DOI: 10.15376/biores.11.1.800-810