
Abstract
Armeniaca sibirica shell activated carbon (ASSAC) magnetized by nanoparticle Fe3O4 prepared from Armeniaca sibirica shell was investigated to determine its adsorption for Hg2+ from wastewater. Fe3O4/ASSAC was characterized using XRD (X-ray diffraction), FTIR (Fourier transform infrared spectroscopy), SEM (scanning electron microscopy), and BET (Brunauer–Emmett–Teller). Optimum adsorption parameters were determined based on the initial concentration of Hg2+, reaction time, reaction temperature, and pH value in adsorption studies. The experiment results demonstrated that the specific surface area of ASSAC decreased after magnetization; however the adsorption capacity and removal rate of Hg2+ increased 0.656 mg/g and 0.630%, respectively. When the initial concentration of Hg2+ solution was 250 mg/L and the pH value was 2, the adsorption time was 180 min and the temperature was 30 °C, and with the Fe3O4/ASSAC at 0.05 g, the adsorption reaching 97.1 mg/g, and the removal efficiency was 99.6%. The adsorption capacity of Fe3O4/ASSAC to Hg2+ was in accord with Freundlich isotherm models, and a pseudo-second-order kinetic equation was used to fit the adsorption best. The Gibbs free energy ΔGo < 0,enthalpy change ΔHo < 0, and entropy change ΔSo < 0 which manifested the adsorption was a spontaneous and exothermic process.
Download PDF
Full Article
Nanoparticle Fe3O4 Magnetized Activated Carbon From Armeniaca sibirica Shell for the Adsorption of Hg(II) Ions
Yinan Hao,a,b,# Yanfei Pan,a,b,# Qingwei Du,a,b Xudong Li,a,b and Ximing Wang a,b,*
Armeniaca sibirica shell activated carbon (ASSAC) magnetized by nanoparticle Fe3O4 prepared from Armeniaca sibirica shell was investigated to determine its adsorption for Hg2+ from wastewater. Fe3O4/ASSAC was characterized using XRD (X-ray diffraction), FTIR (Fourier transform infrared spectroscopy), SEM (scanning electron microscopy), and BET (Brunauer–Emmett–Teller). Optimum adsorption parameters were determined based on the initial concentration of Hg2+, reaction time, reaction temperature, and pH value in adsorption studies. The experiment results demonstrated that the specific surface area of ASSAC decreased after magnetization; however the adsorption capacity and removal rate of Hg2+ increased 0.656 mg/g and 0.630%, respectively. When the initial concentration of Hg2+ solution was 250 mg/L and the pH value was 2, the adsorption time was 180 min and the temperature was 30 °C, and with the Fe3O4/ASSAC at 0.05 g, the adsorption reaching 97.1 mg/g, and the removal efficiency was 99.6%. The adsorption capacity of Fe3O4/ASSAC to Hg2+ was in accord with Freundlich isotherm models, and a pseudo-second-order kinetic equation was used to fit the adsorption best. The Gibbs free energy ΔGo < 0,enthalpy change ΔHo < 0, and entropy change ΔSo < 0 which manifested the adsorption was a spontaneous and exothermic process.
Keywords: Armeniaca sibirica shell; Activated carbon; Magnetization; Hg2+; Adsorption
Contact information: a: College of Material Science and Art Design, Inner Mongolia Agricultural University, Hohhot, 010018, China; b: Inner Mongolia Key Laboratory for Sand Shrubs Fibrosis and Energy Development and Utilization, Inner Mongolia Agricultural University, Hohhot, 010018, China;
#: These authors contributed equally to this work; * Corresponding author: w_ximing@163.net
GRAPHICAL ABSTRACT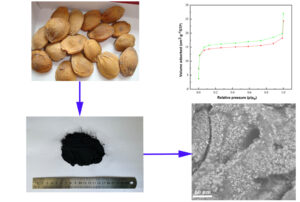
INTRODUCTION
At present, the adsorption method is generally applicable for all kinds of wastewater that includes heavy metal pollution (Hg2+, Pb2+, Zn2+, and Cu2+, etc.) and it also has obvious treatment effects on the refractory pollutants and unmanageable highly toxic products (Zhang et al. 2017). Many conventional technologies, such as ion exchange, flocculation, membrane separation, adsorption, and hybrid methods combining these techniques have been applied in previous studies (Mohammadi et al. 2010). Among these approaches, adsorption is one of the most promising technologies because of its high efficiency, low maintenance costs, and simplicity to operate. Activated carbon adsorption is an effective method to deal with heavy metal wastewater. Activated carbon made from watermelon shells, coconut shells, palm shells, walnut shells and other agricultural residues (Isikgor and Becer 2015) is considered an eco-friendly and effective adsorbent due to its distinctive structure, high surface area, well-developed pore volume, and large number of active sites for adsorbing heavy metal ion adsorbent.
The chemical activation method is a common method for the preparation of activated carbon (Ahmedna et al. 2000). Porous carbon materials have been formed when the raw materials undergo a series of chemical reactions in the presence of chemical reagents, mainly including zinc chloride, potassium hydroxide, potassium carbonate, phosphoric acid, and sodium hydroxide activation method. The activated carbon obtained by chemical activation is difficult to separate after adsorption; therefore, researchers have been devoted to improving the regeneration of activated carbon. The original purpose of researching activated carbon was to extract gold from industrial wastewater by activated carbon adsorption (Mansooreh and Tahereh 2008). However, after decades of development, researchers have found that it has obvious effects on organics adsorption, removal of heavy metal ions or dyes from the water and chemical catalysis (Choi et al. 2015).
Current preparation technology for magnetic activated carbon mainly includes the chemical coprecipitation method, which is prepared magnetic activated carbon in Fe2+ and Fe3+ solution, adding precipitant NaOH, that is to say activated carbon loads nanoparticles of Fe3O4, and the hydrothermal method, namely the prepared microporous activated carbon mixtures with Fe (NO3)3.9H2O and the microporous activated carbon with magnetic surface modification obtained by heating under specified conditions. The above two methods improved the regeneration performance and separation effect of magnetic activated carbon to a certain extent (Chen et al. 2011). However, first the activated carbon is prepared by activation, and then magnetized, each process requires water washing, which leads to some problems such as water pollution, complex washing process, increases in reagent cost and energy consumption (Zhang et al. 2015).
In the present work, the authors used waste Armeniaca sibirica shell (ASS) as raw material activated with ZnCl2 to obtain Armeniaca sibirica shell activated carbon (ASSAC). The activated carbon was directly put into water with no washing, adjusted to the neutral solid-liquid system, and added with nanoparticles of Fe3O4. This allowed Fe3O4/ASSAC to be obtained after dispersion stirring and filtration. The repeated washing process in the preparation of activated carbon and Fe3O4/ASSAC was reduced, and research on the structure, pore size, and specific surface area of ASSAC was conducted, inspecting the effect of initial concentration of Hg2+ solution, pH value, time, and temperature on the adsorption capacity. The optimal adsorption process conditions were confirmed, and the adsorption isotherm and kinetic equation were fitted to explore the adsorption mechanism, providing an efficient and easy separation adsorbent for Hg2+ in wastewater treatment and offering a theoretical basis for its practical application.
EXPERIMENTAL
Materials
Armeniaca sibirica was collected from the Inner Mongolia Autonomous Region, Chifeng City (China). Nano-Fe3O4, trimethylol amino methane, and bromocresol green were supplied by Shanghai Maclin Biochemical Technology Co., Ltd. (Shanghai, China).
Methods
Preparation of magnetic Fe3O4/ASSAC
After drying, 20 g of activated carbon with a particle size of 0.25 mm was put into the water, adjusted to neutral, and 5 g nano-Fe3O4 particles were added with the pH of the solution approximately equal to 6.70, which were dispersed in the ultrasonic dispersing instrument for 2 h. After mixing, a magnetic stirrer was used for 3 h under the temperature of 60 °C. After extraction, Fe3O4/ASSAC with neutral pH was placed in a drying oven at 120 ℃ for 12 h and sealed for preservation.

Fig. 1. The preparation schematic diagram of Fe3O4/ASSAC
Next, 20 mL of HgCl2 solution with known concentrations (10, 20, 30, 40, and 50 mg/L) was measured with a conical flask, put into a water bath thermostatic oscillator (SHA-C, Ronghua Instrument Manufacturing Limited Company, Jintan, China) with a vibration frequency of 120 r/min for 30 min. Then, 2 mL of buffer solution (trimethylol amino methane-HCL solution) and 2 mL of bromocresol green used as chromogenic agent were added, and measurements were conducted with an ultraviolet spectrophotometer (TU-1901, Persee General Instrument Limited Company, Beijing, China). Finally, the standard curve of mercury ion adsorption (Fig.1) was obtained (see also Table S1 in the Appendix).
Y = 0.0061X + 0.0353 (1)
In this formula, Y is absorbance, X is the concentration of mercury ion solution after adsorption equilibrium (mg/L), and R2 is fitting coefficient 0.9971.

Fig. 2. The standard curve of Hg2+
Surface characterization of ASSAC and Fe3O4 /ASSAC
ASSAC and Fe3O4/ASSAC were tested to characterize the functional structure by use of a Tensor 27 Fourier transform infrared spectrometer (Tensor27, Bruker, Karlsruhe, Germany) using KBr disc method. FT-IR spectral data were collected in the 4000 to 400 cm-1 range by co-adding 25 scans at a resolution of 4 cm-1. The phase of ASSAC and Fe3O4/ASSAC were characterized by automatic X-ray diffractometer (XRD-6000, Shimadzu, Kyoto, Japan). The specific conditions were as follows: the scanning range was 10° to 80° and the scanning speed was 4°/min; the microstructure of ASSAC and Fe3O4/ASSAC after spraying gold was analyzed by a PHENOM desktop scanning electron microscope (PhenomPro, PHENOM, Eindhoven, Netherlands), with an accelerating voltage 5 kV and an electric current of 10 mA; the specific surface area and pore structure of ASSAC and Fe3O4/ASSAC were measured by a ber-MiniⅡphysical adsorption instrument (BEL Sorp-mini II, Bayer, Leverkusen, Germany). The BET formula was used to calculate the specific surface area and pore size distribution of ASSAC and Fe3O4/ASSAC at -196 ℃ liquid nitrogen temperature.
Adsorption of Hg2+ by Fe3O4 /ASSAC
In a conical flask, 20 mL of HgCl2 solution of known concentration was measured, and 0.05 g Fe3O4/ASSAC was accurately weighed and added into the solution. The solution was put into a water bath thermostatic oscillator with a vibration speed of 120 r/min. After adsorption, the mixture was centrifuged to separate Fe3O4/ASSAC from the Hg2+ solution by the centrifugation at 2000 rpm for 10 min. Fe3O4 /ASSAC was adsorbed on different initial concentrations (50, 100, 150, 200, and 250 mg/L ), pH value (3, 5, 7, 9, and 11), adsorption time (60, 120, 180, 240, and 300 min), and adsorption Hg2+ solution at 20, 30, 40, 50, and 60 ℃. After adsorption, centrifugation was carried out by centrifuge. Then, 5 mL supernatant was taken from a 50-mL volumetric flask and diluted 10 times with distilled water. Then, 20 mL diluted liquid was transferred into the test tube, and a 2 mL buffer solution (trimethylol amino methane-HCL solution) and 2 mL Bromocresol green were measured, respectively, and added into the test tube. Finally, it was measured by ultraviolet spectrophotometer (TU-1901, Spectrum Analysis, Beijing, China). According to Eq. 2 (Granados-Correa and Bulbulian 2012), the adsorption capacity Q (mg/g) can be calculated; the removal rate can be calculated according to Eq. 3 (Nagpal et al. 2011):
 (2)
(2)
In this formula, Q is adsorption capacity, mg/g, C0 is the initial concentration of Hg2+ before adsorption while Ce is that after adsorption, mg/L, V is the volume of Hg2+ solution, and m is the mass of Fe3O4/ASSAC, mg. The removal efficiency was calculated as follows:
 (3)
(3)
In this formula, P is the removal efficiency (%), C0 is the initial concentration of Hg2+ before adsorption, while Ce is that after adsorption.
RESULTS AND DISCUSSION
FTIR Analysis
Figure 3 shows the FTIR spectra of ASSAC and magnetic Fe3O4/ASSAC. The obvious difference between Fe3O4/ASSAC and ASSAC was that more magnetic Fe3O4 particles were loaded on the surface of Fe3O4/ASSAC. The adsorption peaks at 3680 and 3400 cm-1 are stretching vibration peaks of -OH (Müller et al. 2009); the adsorption peaks at 1735 cm-1 and 1400 cm-1 are characteristic absorption peaks of C-O (Abatan et al. 2019), which indicated that Fe3O4/ASSAC and ASSAC surfaces had certain amounts of oxygen-containing functional groups. Compared with the FTIR of ASSAC, a new absorption peak appeared at 489 cm-1 in the FTIR diagram of Fe3O4/ASSAC, which was the Fe-O stretching vibration peak at the tetrahedral point of Fe3O4 crystal, indicating that Fe3O4 was successfully loaded on the surface of Fe3O4/ASSAC to obtain the magnetic ASSAC with Fe3O4.

Fig. 3. FTIR spectra of (a) ASSAC and (b) Fe3O4/ASSAC
XRD Analysis
Figure 4 shows the XRD spectra of ASSAC and Fe3O4/ASSAC. It can be seen that there was an obvious diffraction characteristic peak at 2θ = 25° of the (002) crystal plane. After magnetization treatment, the intensity of the peak decreased, which made the disorder degree of microcrystalline structure increase greatly. The peaks at 30.2°, 35.7°, 43.0°, 57.2°, and 62.5° are characteristic diffraction peaks on the crystallographic plane (220), (311), (400), (511), and (440), respectively (Oh et al. 2015), which is consistent with the characteristic peaks of Joint Committee on Powder Diffraction Standards (JCPDS) of Fe3O4. Different Fe3O4 crystallographic planes can be expressed by diffraction characteristic peaks, which indicated that nanoparticles of Fe3O4 were loaded on the surface of ASSAC. The crystalline of activated carbon of ASS before and after magnetization were 15.6% and 41.5%, respectively, indicating that magnetization greatly increased the crystallinity.

Fig. 4. XRD spectra of (a) ASSAC and (b) Fe3O4/ASSAC
SEM Analysis
Figures 5a and b are SEM images of ASSAC at 5000 x and 10000 x, respectively. Figures 5c and 5d are SEM images of Fe3O4/ASSAC at 5000 x and 10000 x, respectively. It can be seen from Figs. 5a and b that ASSAC had the characteristics of cluster-like micropores, the internal structure is relatively loose, and the surface is smooth, which is conductive to the nano-Fe3O4 particles entering the loose structure, providing conditions for Hg2+ adsorption. It can be seen from Figs. 5c and d that nano Fe3O4 particles were fully attached to the surface of ASSAC, showing agglomeration.
BET Analysis
Figure 6 shows the specific surface area pore size analysis of Fe3O4/ASSAC and ASSAC. Nitrogen adsorption was measured at 27 ℃ with N2 as the adsorption medium. According to IUPAC classification, the adsorption curves of Fe3O4/ASSAC and ASSAC were type Ⅰ adsorption isotherms. From Fig. 6, the conclusion can be drawn that because the relative pressure (p/p0) was approximately 0.05, the adsorption capacity of Fe3O4/ASSAC and ASSAC was increasing, and the rising trend was obvious. This is because the microporous adsorption and rapid filling were caused by the rich pores, and the adsorption amount increased slowly when the relative pressure reached 0.1 to 0.9, which indicates that there are abundant mesoporous structures, and the adsorption capacity is fast when the relative pressure is above 0.9. These findings are consistent with the capillary condensation of macropores and the formation of macropores (Benadjemia et al. 2011).

Fig. 5. SEM images of (a,b) ASSAC and (c,d) Fe3O4/ASSAC

Fig. 6. A: Nitrogen adsorption-desorption isotherms of Fe3O4/ASSAC, B: Pore size distribution (a): Fe3O4/ASSAC, (b): ASSAC
According to the BET calculation, the specific surface areas of ASSAC and Fe3O4/ASSAC were 1.28×10³ and 1.13×10³ m2/g, respectively, while the specific surface area ratio of Fe3O4/ASSAC was reduced 158 m2/g, as shown in Table S2 (Appendix). The ASSAC had certain micropore and mesoporous structure, while Fe3O4/ASSAC had developed mesoporous structure, the internal volume of 10 to 20 nm was the largest, and the pore diameter decreased from 0.775 nm to 0.668 nm, indicating that part of the magnetized ASSAC micropore structure was supported by nano Fe3O4, and the mesoporous structure that plays a major role of adsorption had little change.
Adsorption of Hg2+ of ASSAC and Fe3O4/ASSAC
The effect of the initial concentration of Hg2+
As shown in Fig. 7, the adsorption capacity of ASSAC and Fe3O4/ASSAC for Hg2+ increased with the increase of solution concentration in the range of 50 mg/L to 250 mg/L. When the initial concentration of Hg2+ solution was up to 250 mg/L, the maximum adsorption capacity was 96.4 and 97.1 mg/g, respectively. When the initial concentration of Hg2+ solution exceeded 250 mg/L, the curve tended to be gentle, and the adsorption capacity almost did not increase; when the initial concentration of Hg2+ solution was 50 to 100 mg/L, the curve showed a downward trend, and the removal rate of Hg2+ by ASSAC and Fe3O4/ASSAC decreased gradually. In the range of 100 to 200 mg/L, the Hg2+ removal rate of ASSAC and Fe3O4/ASSAC increased. When the initial concentration of Hg2+ solution reached 250 mg/L, the removal rate was the highest; the maximum values were 98.0% and 97.1%, respectively. When the initial concentration of the solution exceeded 250 mg/L, the curve gradually decreased, and the removal rate decreased slowly.

Fig. 7. The effect of initial Hg2+ concentration on adsorption and removal rate of Hg2+; A: the adsorption capacity and removal rate of Hg2+ by ASSAC; B: the adsorption capacity and removal rate of Hg2+ by Fe3O4/ASSAC
It can be seen from Fig. 7 that when the initial concentration increased from 50 mg/L to 350 mg/L, the adsorption capacity of ASSAC and Fe3O4/ASSAC for Hg2+ first increased and then tended to reach a stable state, and the removal rate also increased and then decreased. The ASSAC first increased from 65.7% to 98.0%, and then decreased to 57.6%, and Fe3O4/ASSAC first increased from 69.0% to 97.1%, and then decreased to 60.4%. After analysis, the number of activated sites provided by ASSAC and Fe3O4/ASSAC was limited. Once the maximum number of adsorption active sites is exceeded, ASSAC and Fe3O4/ASSAC will not be adsorbed or the adsorption effect will become worse. When the initial concentration of Hg2+ exceeds the maximum number of active points, the success of Hg2+ binding with ASSAC and Fe3O4/ASSAC surface adsorption activation sites will decrease, and the adsorption effect will decline, so the adsorption capacity and removal rate will decrease (Shroff and Vaidya 2011).
The effect of pH value of Hg2+ solution
Figure 8 shows the effect of pH value on the adsorption and removal performance of Hg2+ solution under the conditions of initial concentration of Hg2+ solution of 200 mg/L, adsorption time of 180 min, adsorption temperature of 30 ℃, and ASSAC and Fe3O4/ASSAC of 0.05 g. The adsorption capacity of ASSAC and Fe3O4/ASSAC for Hg2+ solution increased gradually from 1 to 2, and reached the maximum at pH = 2, giving values of 77.7 and 79.7 mg/g, respectively. When pH was at 11, the adsorption curve showed a downward trend. The removal rates of ASSAC and Fe3O4/ASSAC increased from 1 to 2, and reached the maximum at pH = 2, which were 97.2% and 99.6%, respectively. The removal rate curve showed a downward trend when pH = 11. This is because the functional groups (hydroxyl and carboxyl) of ASSAC and Fe3O4/ASSAC begin to release hydrogen ions and reach deprotonation at pH from 1 to 2 (Zarandi et al. 2016). An increased amount of sites with negative charge promote the adsorption of Hg2+, and the adsorption is the best at pH = 2. When the pH was higher than 2, the hydrolysis and polymerization increased greatly, so the adsorption amount and removal rate of Hg2+ decreased.

Fig. 8. The effect of pH on adsorption and removal rate of Hg2+; A: the adsorption capacity and removal rate of Hg2+ by ASSAC; B: the adsorption capacity and removal rate of Hg2+ by Fe3O4/ASSAC
The effect of adsorption temperature
Figure 9 (a) and (b) show the adsorption capacity and removal rate of Hg2+ by ASSAC, and (c) and (d) respectively represent the adsorption capacity and removal rate of Hg2+ by Fe3O4/ASSAC. It can be seen from the curves (a) and (b) in Fig. 9 that when the initial concentration of Hg2+ was 200 mg/L, the pH value was 2, the time was 180 min, the ASSAC was 0.05 g, the temperature rose from 20 ℃ to 30 ℃, and the adsorption capacity increased from 68.5 mg/g to 72.5 mg/g. When the temperature continued to rise, the adsorption capacity slowly decreased with the increase of temperature. This is because the adsorption of Hg2+ by ASSAC is an exothermic reaction, so the adsorption capacity of ASSAC surface was reduced when the temperature was higher than 30 ℃. Therefore, the optimal temperature of ASSAC for Hg2+ adsorption was 30 ℃. When the temperature increased from 20 ℃ to 30 ℃, the removal rate of ASSAC increased from 85.7% to 90.6%. When the temperature continued to rise, the removal rate gradually decreased with the increase of temperature. This is because the adsorption of Hg2+ by ASSAC is an exothermic reaction, so the removal capacity of ASSAC is reduced by increasing the temperature.

Fig. 9. The effect of temperature on adsorption and removal rate of Hg2+; A: the adsorption capacity and removal rate of Hg2+ by ASSAC; B: the adsorption capacity and removal rate of Hg2+ by Fe3O4/ASSAC
It can be seen from the curves (c) and (d) in Fig. 9 that when the initial concentration of Hg2+ was 200 mg/L, the pH value was 2, the time was 180 min, and the Fe3O4/ASSAC was 0.05 g, the adsorption capacity increased from 70.5 to 74.4 mg/g when the temperature rose from 20 ℃ to 30 ℃, and the adsorption capacity decreased slowly with the increase of temperature. The adsorption of Hg2+ on Fe3O4 /ASSAC is exothermic, thus increasing temperature decreased the adsorption capacity. When the temperature was higher than 30 ℃, the adsorption capacity decreased, so the optimal temperature of Fe3O4/ASSAC for Hg2+ adsorption was 30 ℃. When the temperature increased from 20 to 30 ℃, the removal rate of Fe3O4/ASSAC increased from 88.1% to 93.1%. The temperature continued to rise, and the removal rate decreased slowly with the increase of temperature. This was because the adsorption of Hg2+ by Fe3O4/ASSAC is an exothermic reaction, thus increasing temperature reduced the removal ability of activated carbon from ASS.
The effect of adsorption time
Figure 10(a) and (b) show the adsorption capacity and removal rate of Hg2 + by ASSAC, and (c) and (d) respectively represent the adsorption capacity and removal rate of Hg2 + by Fe3O4/ASSAC. It can be seen from the curves (a) and (b) in Fig. 10 that when the initial concentration of Hg2+ was 200 mg/ L, pH = 2, time was 180 min, and ASSAC was 0.05 g, the adsorption capacity and removal rate of ASSAC first slowly increased and then gradually decreased with the extension of time. When the adsorption time was 300 min, the maximum adsorption capacity was 64.0 mg/g, and the maximum removal rate was 79.9%. It can be seen from the curves (c) and (d) in Fig. 10 that under the conditions of initial Hg2+ concentration of 200 mg/L, pH value of 2, time of 180 min and Fe3O4/ASSAC of 0.05 g, the adsorption capacity and removal rate of Fe3O4/ASSAC gradually increased with time from 60 to 180 min, reached equilibrium at 180 to 300 min, and the adsorption capacity and removal rate almost continued to decrease. Therefore, the optimal adsorption time was 180 min, the maximum adsorption capacity was 65.921 mg/g, and the maximum removal rate was 82.1%.

Fig. 10. The effect of time on adsorption and removal rate of Hg2+; A: the adsorption capacity and removal rate of Hg2+ by ASSAC; B: the adsorption capacity and removal rate of Hg2+ by Fe3O4/ASSAC
It can be seen from Fig. 10 that the adsorption effect of ASSAC and Fe3O4/ASSAC for Hg2+ increased with the extension of adsorption time. When Fe3O4/ASSAC adsorbed Hg2+ solution for 60 to 180 min, there was a high concentration of Hg2+ in the solution and there were many adsorption active sites on Fe3O4/ASSAC surface, so it was high mass transfer power in adsorption and the adsorption rate was fast; when the adsorption time was 180 min, the removal rate and adsorption capacity could best reach 82.4% and 65.9 mg/g, respectively; when the adsorption time was 180 min, the Fe3O4/ASSAC surface active adsorption point gradually reached saturation. The adsorption rate and adsorption capacity of Fe3O4/ASSAC were affected by the adsorption time that further diffusion to Fe3O4/ASSAC, and the adsorption speed was significantly slowed down because of the large diffusion resistance in the process. The adsorption time was more than 180 min, the adsorption efficiency of Fe3O4/ASSAC for Hg2+ reached a dynamic equilibrium, so the removal rate and adsorption capacity of Fe3O4/ASSAC for Hg2+ solution would not increase.
Adsorption Kinetics
Pseudo-first-order, pseudo-second-order, and intra-particle diffusion kinetic equations were used to describe the adsorption rate of Hg2+ by Fe3O4/ASSAC. The data were fitted by the model to study the adsorption mechanism.
Predictions of adsorption rates provide important information regarding adsorption mechanisms. To evaluate the kinetics of Hg2+ adsorption by Fe3O4/ASSAC, the experimental data at various adsorption times corresponding to the changes in adsorption capacity were fit using pseudo-first-order, pseudo-second-order, and intra-particle diffusion (Kilic et al. 2011), which are described as Eqs. 4 through 6. The pseudo-first-order kinetic equation:
 (4)
(4)
The pseudo-second-order kinetic equation:
 (5)
(5)
The intra-particle diffusion kinetic equation can be expressed as,
 (6)
(6)
where Qe and Qt are the amounts of heavy metal ions adsorbed (mg/g) at equilibrium and at time t (min), respectively; k1 (min-1) is the pseudo-first-order rate constant; k2 [g·(mg/min) -1] is the rate constant of the pseudo-second-order adsorption kinetic equation; ki [mg·(g·min0.5)-1] is an intra-particle diffusion rate constant.

Fig. 11. Pseudo-first-order (A), pseudo-second-order (B), and intra-particle diffusion model (C) kinetic models for the adsorption of Hg2+ by Fe3O4/ASSAC
Table 1. R2 and Constant Valves for the Different Adsorption Kinetics Models of Hg2+

The fits of these three models were checked by each linear plot of ln (Qe – Qt) versus t (Fig. 11a), (t/Qt) versus t (Fig. 11b), and Qt versus t0.5 (Fig. 11c), respectively. The R2 and constant values for the three adsorption kinetic models were calculated, and the results are given in Table 1. According to the calculated kinetic model parameters in Table 1 and from comparing the experimental equilibrium adsorption capacity, it was found that the values provided by the pseudo-second-order model were more similar to the estimated equilibrium adsorption capacity than those provided by the pseudo-first-order, and intra-particle diffusion models. Moreover, it could be observed that the R2 value of the pseudo-second-order kinetic model was close to 1.0 [R2 (0.999)]. The adsorption data of Hg2+ solution by Fe3O4/ASSAC suggested that the pseudo-second-order model better described the adsorption kinetic process. This implies that rate of uptake slows down to a greater extent than one would expect based on the mere filling of adsorption sites, and the adsorption rate of Fe3O4/ASSAC is governed by a process of diffusion to adsorption sites within a network of pores within the material (Hubbe et al. 2019).
Adsorption isotherm
Adsorption isotherms define the characteristics of the adsorption process and are important for describing how Hg2+ interacted with adsorbents to guide useful application in wastewater treatment. The Langmuir, Freundlich, and Temkin models (Aparna et al. 2013) were applied to fit the adsorption equilibrium data obtained from the batch adsorption systems, which are expressed as Eqs. 7 through 9. Langmuir adsorption isotherm:
 (7)
(7)
Freundlich adsorption isotherm:
 (8)
(8)
Temkin adsorption isotherm:
 (9)
(9)
where KL (L/mg) is the Langmuir constant related to the adsorption capacity; Qm (mg/g) is the monolayer saturation adsorption capacity; 1/n is the value used to indicate the heterogeneity of the interface; Kf is the Freundlich constant; Ce (mg/L) is the concentration of metal ions at equilibrium; Qe (mg/g) is the adsorption capacity at equilibrium; R is the ideal gas constant (8.314 Jmol-1 K-1); T (K) is the absolute temperature of the adsorption process; and αt (L/g) and bt (J/mol) are Temkin isotherm constants.

Fig. 12. Langmuir (A), Freundlich (B), and Temkin (C) isotherm models for the adsorption of Hg2+ solution by Fe3O4/ASSAC
Table 2. R2 and Constant Values for the Adsorption Isotherm Models of Hg2+

Comparisons of these isotherm models for the adsorption of Hg2+ by Fe3O4/ASSAC were performed by comparing each linear plot of Ce/Qe versus Ce (Fig. 12a), lnQe versus lnCe (Fig. 12b), and Qe versus lnCe (Fig. 12c). The calculated constants are listed in Table 2. From Fig. 12 and Table 2, it is clear that the Freundlich model provided the best fit relative to the other models and R2 values of 0.985. It is understood that the Freundlich model is consistent with adsorption on a heterogeneous surface in nature with a non-uniform distribution of adsorption heat on the surface.
Thermodynamic Parameters
Thermodynamic parameters were calculated to determine which process would occur spontaneously. The changes of thermodynamic parameters (ΔHo, ΔSo and ΔGo) would produce an insight into the mechanism and adsorption nature of an isolated system. The values of enthalpy (ΔHo) and entropy (ΔS o) can be calculated from the slope and intercept of the plot of lnK vs 1/T according to Eq. 10, and the Gibb’s free energy change (ΔG o) was calculated from the Langmuir equilibrium constant with units of liters per mole according to Eq. 11,
 (10)
(10)
 (11)
(11)
 (12)
(12)
where △Go (J/mol) is the Gibbs free energy; △Ho (J/mol) is the enthalpy of adsorption; △So (Jmol-1K-1) is the adsorption entropy; T (K) is the adsorption temperature; R is the ideal gas constant (8.314 Jmol-1 K-1); Qe (mg/g) is the adsorption capacity at equilibrium; and Ce (mg/L) is the concentration of metal ions at equilibrium.
Table 3. Thermodynamic Parameters on Adsorption of Hg2+ by Fe3O4/ASSAC

It can be concluded from Table 3 that △Ho < 0, which indicated that the adsorption of Hg2+ by Fe3O4/ASSAC was an exothermic reaction, △Go < 0 indicated that the adsorption of Hg2+ by Fe3O4/ASSAC was spontaneous, and △So < 0 indicated that the molecules on the interface moved disorderly during the adsorption of Hg2+ by Fe3O4/ASSAC. It can be concluded that the adsorption of Hg2+ by Fe3O4/ASSAC is a process of the decrease of spontaneous heat entropy (Singha and Das 2011).
CONCLUSIONS
- Fe3O4 nanoparticles were directly added into the neutral solid-liquid system of Armeniaca sibirica shell activated carbon (ASSAC), and Fe3O4/ASSAC was synthesized by dispersing and stirring, which reduced the repeated washing process between the preparation of activated carbon and Fe3O4/ASSAC. The results showed that Fe3O4 nanoparticles were loaded on the surface of Xanthoceras sorbifolia activated carbon, and there were iron oxide functional groups on Fe3O4/ASSAC. The crystallinity was increased, and compared with ASSAC, the surface area was reduced 139 m2/g. The pore size of ASSAC decreased from 0.775 nm to 0.668 nm at m2/g, some of the microporous structures of the magnetized ASSAC were supported by nano-Fe3O4, and the mesoporous structure, which plays the main role of adsorption had little change.
- The results of adsorption of Hg2+ by ASSAC showed that when the initial concentration of Hg2+ solution was 250 mg/L, the adsorption time was 300 min, the adsorption temperature was 30 ℃, the pH value was 2, and the addition amount of ASSAC was 0.05 g, ASSAC had the highest adsorption capacity and removal rate of Hg2+, which were 96.4 mg/g and 98.0 mg/g, respectively.
- The results of adsorption of Hg2+ by Fe3O4/ASSAC showed that when the initial concentration of Hg2+ was 250 mg/L, the adsorption time was 180 min, the adsorption temperature was 30 ℃, the pH value was 2, the addition amount of Fe3O4/ASSAC was 0.05 g, and the adsorption capacity and removal rate of Fe3O4/ASSAC to Hg2+ were the highest, 97.1 mg/g and 99.6 mg/g, respectively.
- The adsorption process of Fe3O4/ASSAC for Hg2+ was in accordance with pseudo-second-order kinetic equation and Freundlich isotherm model. The thermodynamic adsorption showed that the adsorption process was a process of decreasing spontaneous heat entropy.
Authors’ Contributions
Yinan Hao and Yanfei Pan contributed equally to this paper.
ACKNOWLEDGMENTS
This work was supported by the Transformation Fund for Science and Technology Achievements of Inner Mongolia Autonomous Region (No. 2019CG018); the Natural Science Foundation of Inner Mongolia Autonomous Region (Nos. 2018BS03004 and 2019BS03014); and the Talent Development Fund of Inner Mongolia.
REFERENCES CITED
Abatan, O. G., Oni, B. A., Agboola, O., Efevbokhan, V., and Abiodun, O. O. (2019). “Production of activated carbon from African star apple seed husks, oil seed and whole seed for wastewater treatment,” Journal of Cleaner Production 232, 441-450. DOI: 10.1016/j.jclepro.2019.05.378
Ahmedna, M., Marshall, W. E., and Rao, R. M. (2000). “Production of granular activated carbons from select agricultural by-products and evaluation of their physical, chemical and adsorption properties,” Bioresource Technology 71(2), 113-123. DOI: 10.1016/s0960-8524(99)00070-x
Aparna, R., Adhikari, B., and Majumder, S. B. (2013). “Equilibrium, kinetic, and thermodynamic studies of Azo dye adsorption from aqueous solution by chemically modified lignocellulosic jute fiber,” Industrial & Engineering Chemistry Research 52(19), 6502-6512. DOI: 10.1021/ie400236s
Benadjemia, M., Millière, L., Reinert, L., Benderdouche, N., and Duclaux, L. (2011). “Preparation, characterization and methylene blue adsorption of phosphoric acid activated carbons from globe artichoke leaves,” Fuel Processing Technology 92(6), 1203-1212. DOI: 10.1016/j.fuproc.2011.01.014
Choi, G., Oh, S., Lee, S., and Kim, J. (2015). “Production of bio-based phenolic resin and activated carbon from bio-oil and biochar derived from fast pyrolysis of palm kernel shells,” Bioresource Technology 178, 99-107. DOI: 10.1016/j. biortech.2014.08.053
Chen, B., Chen Z., and Lv, S. (2011). “A novel magnetic biochar efficiently sorbs organic pollutants and phosphate,” Bioresource Technology 102(2), 716-723. DOI: 10.1016/j.biortech. 2010.08.067
Granados-Correa, F., and Bulbulian, S. (2012). “Co(II) adsorption in aqueous media by a synthetic Fe-Mn binary oxide adsorbent,” Water Air and Soil Pollution 223(7), 4089-4100. DOI: 10.1007/s11270-012-1175-8
Hubbe, M. A., Azizian, S., and Douven, S. (2019). “Implications of apparent pseudo-second-order adsorption kinetics onto cellulosic materials. A review,” BioResources 14(3), 7582-7626. DOI:10.15376/biores.14.3.7582-7626
Mohammadi, S. Z., Karimi, M. A., Afzali, D., and Mansouri, F. (2010). “Removal of Pb(II) from aqueous solutions using activated carbon from Sea-buckthorn stones by chemical activation,” Desalination 262(1-3), 86-93. DOI: 10.1016/j.desal.2010.05.048
Isikgor, F. H., and Becer, C. R. (2015). “Lignocellulosic biomass: A sustainable platform for the production of bio-based chemicals and polymers,” Polymer Chemistry 6(25), 4497-4559. DOI: 10.1039/C5PY00263J
Kilic, M., Apaydin-Varol, E., and Pütün, A. E. (2011). “Adsorptive removal of phenol from aqueous solutions on activated carbon prepared from tobacco residues: Equilibrium, kinetics and thermodynamics,” Journal of Hazardous Materials 189(1-2), 397-403. DOI: 10.1016/j.jhazmat.2011.02.051
Mansooreh, S., and Tahereh, K. (2008). “Activated hard shell of apricot stones: A promising adsorbent in gold recovery,” Chinese Journal of Chemical Engineering 16(1), 112-118. DOI:10.1016/S1004-9541(08)60048-8
Müller, G., Schöpper, C., Vos, H., Kharazipour, A., and Polle, A. (2009). “FTIR-ATR spectroscopic analyses of changes in wood properties during particle- and fibreboard production of hard and softwood trees,” BioResources 4(1), 49-71.
DOI: 10.15376 /biores.4.1.49-71
Nagpal, U. M. K., Bankar, A. V., Pawar, N. J., Kapadnis, B. P., and Zinjarde, S. S. (2011). “Equilibrium and kinetic studies on biosorption of heavy metals by leaf powder of paper mulberry (Broussonetia papyrifera),” Water Air and Soil Pollution 215(1), 177-188. DOI: 10.1007/s11270-010-0468-z
Oh, W. D., Lua, S. K., Dong, Z. L., and Lim, T. T. (2015). “Performance of magnetic activated carbon composite as peroxymonosulfate activator and regenerable adsorbent via sulfate radical-mediated oxidation processes” Journal of Hazardous Materials 284, 1-9. DOI: 10.1016/j.jhazmat.2014.10.042
Shroff, K. A., and Vaidya, V. K. (2011). “Kinetics and equilibrium studies on biosorption of nickel from aqueous solution by dead fungal biomass of Mucor hiemalis,” Chemical Engineering Journal 171(3), 1234-1245. DOI: 10.1016/j.cej.2011.05.034
Singha, B., and Das, S. K. (2011). “Biosorption of Cr(VI) ions from aqueous solutions: Kinetics, equilibrium, thermodynamics and desorption studies,” Colloids and Surfaces B: Biointerfaces 84(1), 221-232. DOI: 10.1016/j.colsurfb.2011.01.004
Zhang, S., Tao, L., Jiang, M., Gou, G., and Zhou, Z. (2015). “Single-step synthesis of magnetic activated carbon from peanut shell,” Materials Letters 157, 281-284. DOI: 10.1016/j.matlet.2015.05.117
Zhang, X., Hao, Y., Wang, X., and Chen, Z. (2017). “Adsorption of iron(III), cobalt(II), and nickel(II) on activated carbon derived from Xanthoceras sorbifolia bunge hull: Mechanisms, kinetics and influencing parameters,” Water Science and Technology 75(7-8), 1849-1861. DOI: 10.2166/wst.2017.067
Zarandi, M. J. E., Sohrabi, M. R., Khosravi, M., Mansouriieh, N., Davallo, M., and Khosravan, A. (2016). “Optimizing Cu(II) removal from aqueous solution by magnetic nanoparticles immobilized on activated carbon using Taguchi method,” Water Science and Technology 74(1), 38-47. DOI: 10.2166/wst.2016.152
Article submitted: April 7, 2021; Peer review completed: June 26, 2021; Revised version received: July 8, 2021; Accepted: July 9, 2021; Published: July 19, 2021.
DOI: 10.15376/biores.16.3.6100-6120
APPENDIX
Table S1. Data of Standard Curve of Hg2+

Table S2. BET Surface Areas, Pore Volumes and Pore Sizes of Samples
