
Abstract
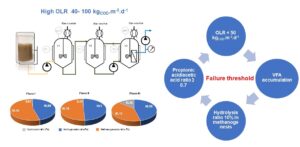
A two-stage submerged anaerobic membrane bioreactor (2-sAnMBR) was operated to demonstrate the technology concept and to accelerate anaerobic biodegradation of Palm Oil Mill Effluent (POME). Then, the impact of different high organic loading rates (OLR) was investigated with a focus on water quality and biogas production. OLR higher than 50 kgCOD.m-3.d-1 induced an increase of volatile fatty acids (VFAs). As a consequence, the biogas production decreased from 19.8 to 11.0 L.d-1 and CH4 yield between 0.23 to 0.38 LCH4/gCODremoved. Nevertheless, the highest OLR (98 kgCOD.m-3.d-1) made it possible to reach a COD removal effectiveness of 70%, where the membrane contribution was around 23.9% to 34.7%. The ratio of propionic acid/acetic acid appeared to be a key indicator to prevent the AnMBR operation failure. Indeed, as soon as the value of 0.7 has been exceeded, several signs of AnMBR failure appeared. The methanogenic activity in AnMBR was inhibited by a hydrolysis ratio of 13% which transformed to VFA accumulation in system. The 250 mg.L-1 of Phenol concentration in POME was an inhibitory of the microbe in this system. Suspended solids concentration, proteins, polysaccharides, and volatile fatty acids were the substantial parameters that influenced the fouling rate.
Download PDF
Full Article
Performance of a High Rate Two-Stage Anaerobic Membrane Bioreactor (AnMBR) for the Treatment of Palm Oil Mill Effluent
Wiparat Chaipetch,a Watsa Khongnakorn,a,b* Chaowana Yirong,a Jomjai Boonkan,b Arisa Jaiyu,c and Marc Heran d
A two-stage submerged anaerobic membrane bioreactor (2-sAnMBR) was operated to demonstrate the technology concept and to accelerate anaerobic biodegradation of Palm Oil Mill Effluent (POME). Then, the impact of different high organic loading rates (OLR) was investigated with a focus on water quality and biogas production. OLR higher than 50 kgCOD.m-3.d-1 induced an increase of volatile fatty acids (VFAs). As a consequence, the biogas production decreased from 19.8 to 11.0 L.d-1 and CH4 yield between 0.23 to 0.38 LCH4/gCODremoved. Nevertheless, the highest OLR (98 kgCOD.m-3.d-1) made it possible to reach a COD removal effectiveness of 70%, where the membrane contribution was around 23.9% to 34.7%. The ratio of propionic acid/acetic acid appeared to be a key indicator to prevent the AnMBR operation failure. Indeed, as soon as the value of 0.7 has been exceeded, several signs of AnMBR failure appeared. The methanogenic activity in AnMBR was inhibited by a hydrolysis ratio of 13% which transformed to VFA accumulation in system. The 250 mg.L-1 of Phenol concentration in POME was an inhibitory of the microbe in this system. Suspended solids concentration, proteins, polysaccharides, and volatile fatty acids were the substantial parameters that influenced the fouling rate.
DOI: 10.15376/biores.17.2.3398-3412
Keywords: Palm oil mill effluent (POME); Anaerobic membrane bioreactor (AnMBR); High loading rate; Long operation; Methane yield; Volatile fatty acids (VFA)
Contact information: a: Department of Civil and Environmental Engineering, Faculty of Engineering, Prince of Songkla University, Songkhla 90110 Thailand; b: Center of Excellence in Membrane Science and Technology, Prince of Songkla University, Songkhla 90110 Thailand; c: Expert Center of Innovative Materials, Thailand Institute of Scientific and Technological Research, Khlong Luang 12120, Thailand; d: Institut Européen des Membranes, IEM, UMR 5635, CNRS, ENSCM, University of Montpellier, Montpellier 34095 Cedex 5 France; *Corresponding author: watsa.k@psu.ac.th
GRAPHICAL ABSTRACT
INTRODUCTION
Anaerobic-aerobic lagoon systems are applied to treat a wide range of pollutants before being discharged into water bodies and lands. Anaerobic digestion (AD) consists of a four-step process involving four different types of microbe groups: hydrolysis, acidogenic, acetogenic, and methanogenic. A high organic loading rate (OLR) in a single-phase reactor may cause inhibitions from, for example, rising VFA and phenols. Therefore, several authors have suggested a two-stage anaerobic process as a solution, which could reduce various inhibitors, e.g., volatile fatty acids (VFAs), phenols, etc. As a result, it increases the treatment capacity and performance. The two-stage AD has been applied for the POME treatment (Mamimin et al. 2012; Mota et al. 2013; Chaikasem et al. 2014; Khan et al. 2019; Krishnan et al. 2019). Palm oil mill effluent (POME) contains high amounts of organic compounds, phenolic compounds, and color, which may cause water pollution. The using of POME for biogas production (CH4, CO2, H2S, etc.) through AD has widely been reported (Teng et al. 2013; Hasanudin et al. 2015; Aziz and Hanafiah 2017). In the two-stage AD, POME is first converted to VFAs during the acid-forming stage (commonly referred as hydrolysis, acidogenesis, and acetogenesis). Then, during the second stage, the VFAs are converted into biogas through methanogenesis (Teng et al. 2013). However, the operational factors, e.g., OLR, VFAs, pH, etc., must be carefully controlled to ensure good equilibrium between acid formation and methane production via effective bacteria diversity and activity to prevent failure from accumulating acids (Cheng et al. 2020). Borja et al. (1996) conducted a two-stage up flow anaerobic sludge blanket (UASB) for treating POME under mesophilic conditions. The organic loading rate was gradually increased from 2.3 to 17.3 kgCOD.m-3.d-1 over 120 days of experiment. The OLR at a level of 16.6 kgCOD.m-3.d-1 yielded a high acid concentration, which later induced failure at an OLR of 17.3 kgCOD.m-3.d-1. The maximum acid production was found to be 4.1 kgCOD.m-3.d-1. Gas production mainly consisted of CO2 with low methane content. A 1-2% hydrogen gas content was found at higher OLRs, with further reduced methane content (Borja et al. 1996). Once the biomass is inhibited, an increase of OLR will decrease the methane production. Mamimin et al. (2015) conducted a two-stage (thermophilic and mesophilic) anaerobic sequential batch reactor (ASBR) of POME with am OLR of 60 kgCOD.m-3.d-1 under 2-day hydraulic retention time (HRT). Their results showed a 38% COD removal in thermophilic reactor. It can be noted that the limitation of two stage AD is around 20 kgCOD.m-3.d-1. The higher OLR of POME leads to the failure of two stage AD. Hence, a two-stage submerged anaerobic membrane bioreactor (2-sAnMBR) was proposed for high OLR and high solid content instead of AD. A high-solid AnMBR has been studied for the benefit of biogas production via anaerobic digestion (Cheng et al. 2020; Ariunbaatar et al. 2021). The operating conditions of both stages must be well controlled for the better effective treatment at high OLRs, especially with the self-inhibiting products such as phenols in POME. At high OLRs, there are many factors affecting filtration performances, e.g., soluble microbial product (SMP), MLSS, viscosity, VFAs, etc. (Qiao et al. 2013; Li et al. 2020).
The aim of this study was to assess the performance of a two-stage anaerobic treatment involving high AnMBR OLR. Afterward, the purpose was focused on the identification of the relevant parameters/elements to be monitored in order to overcome the limiting factors under high OLRs. These inhibiting factors were also analyzed in order to determine the system maximum capacity and to increase and improve the use of AnMBR for high OLR and solids feeding by POME effluent.
EXPERIMENTAL
Palm Oil Mill Effluent (POME) and Inoculum Sludge
The POME wastewater and sludge samples were collected from a covered lagoon bioreactor (CLBR) in the Surat Thani palm oil factory, Thailand. The characteristics of the POME and sludge inoculum were analyzed following the Standard methods outlined by AWWA (2012); the results are presented in Table 1. The POME sample was stored at a temperature of 4 °C until used to minimize self-biodegradation. At the beginning, wastewater and seed sludge were added to the reactor in a 1:1 (v/v) proportion. Then, this inoculum has been acclimatized after step feeding with 10% of POME concentration during four weeks in order to enhance AnMBR’s startup success.
Experimental Setup and Operation of a Two-stage Anaerobic Membrane Bioreactors (AnMBR)
A schematic diagram detailing the set-up of the two-stage anaerobic bioreactor is shown in Fig. 1. It consisted of an anaerobic hydrolytic reactor (HR) and an anaerobic membrane bioreactor (AnMBR) made of polysulfone hollow fibers with a 0.025 m2 area, which were fabricated as described in a previous study (Chaipetch et al. 2021). The operational conditions are presented in Table 2. The operating pH of the HR and AnMBR were kept constant at 4.5 ± 0.3 and 7.2 ± 0.2, respectively, with adjustment of 2 M HCl or NaHCO3 solutions. The reactors were operated until stable COD removal and biogas production were reached.
Table 1. Characteristics of Raw Palm Oil Mill Effluent (POME) and Sludge Inoculum (Mean ± Standard Deviation)


Fig. 1. Lab-scale diagram of two-stage submerged anaerobic membrane bioreactor (sAnMBR). pHC: pH controller, TC: temperature controller, V1: Hydrolytic reactor, and V2&V3: Anaerobic membrane bioreactor
The ORP and pH were recorded daily in both HR and AnMBR tank. Samples were collected three times per week to analyze the TCOD, SCOD, TSS, TS, VS, VSS, and alkalinity, following the Standard methods outlined by AWWA (2012). The VFA components were determined via GC/FID (Agilent 7890A, Santa Clara, CA) using a 3 m stainless steel column packed with molecular sieve with 60 mesh to 80 mesh and 100 mesh to 120 mesh. Helium was used as the carrier gas at a flow rate of 35 mL/min. The temperatures of the injection port, oven, and detector were set at 220 °C, 60 °C, and 220 °C, respectively. The volume of biogas production was measured via a gas counter, and the composition of the biogas was measured via gas chromatography using a Shimadzu GC 8A (Kyoto, Japan), which was fitted with a 2 m stainless steel column packed with molecular sieve 58 (80/100 mesh). Helium was used as the carrier gas at a flow rate of 35 mL/min. The temperatures of the injection port, oven, and detector were set at 100 °C, 40 °C, and 100 °C, respectively. The compositions of the biogas were measured via gas chromatography through 0.5 mL gas sample injected in triplicate.
Table 2. Operating Conditions of the Anaerobic Hydrolytic Reactor (HR) and Submerged Anaerobic Membrane Bioreactor (sAnMBR) under Mesophilic Conditions (35 °C ± 5 °C)

The hydrolysis and acidogenesis ratios in HR were calculated according to Eqs. 1 and 2, respectively,
 (1)
(1)
 (2)
(2)
where inf is the influent; eff is the effluent, and TCOD and CODVFA correspond to the total COD and the COD in term of the volatile fatty acids (VFAs), respectively (Cheng et al. 2020).
The acidogenesis and methanogenesis ratios, as well as the observed CH4 yield in AnMBR, were calculated according to Eqs. 3 and 4, respectively,
 (3)
(3)
 (4)
(4)
where CODCH4 corresponds to the COD in term of the methane gas, %CH4 is the methane content in biogas, and Q is the flowrate of the influent (Serna-García et al. 2020).
The impact of the VFAs on the methane yield was determined using SPSS statistical software version 23.0 (IBM, Armonk, NY). The data were analyzed via one-way analysis of variance (ANOVA) using the least significant difference (LSD) at a p-value of less than or equal to 0.05.
The membrane filtration was operated under sub-critical and flux constant modes. To prevent fouling, the relaxing conditions and internal recirculation were set to be the same as the previous study (Chaipetch et al. 2021). The fouling rate was determined by the ratio of flux obtained per transmembrane pressure. The SMP was quantified from the concentration of proteins and carbohydrates. The supernatant was collected after centrifugation at 8000 rpm for 15 min. The sample was filtrated via a 0.45 µm membrane for proteins (PT) and polysaccharides (PS) analysis (Cheng et al. 2020). The PT were analyzed via a modified Lowry method and the PS were analyzed via the phenol sulfuric acid method (Chaipetch et al. 2021). The effects of the parameters, i.e., PT, PS, and MLSS, on membrane fouling were analyzed via multiple linear regression (ANOVA, p-value of less than 0.05). A stepwise multiple linear regression was performed to determine which variables could be used to estimate the fouling rate based on the obtained data (Mota et al. 2013; Navarrete 2020). A 95% confidence level was adopted for all tests. The phenol concentration in the permeate at the end of each phase was analyzed via the spectrophotometry method (Merck spectroquant Prove 100, Merck, Kenilworth, NJ).
RESULTS AND DISCUSSION
Hydrolysis Reactor Performance
The hydrolysis reactor was studied in 3 phases, i.e., phase I (day 0 through 90, with an OLR of 57 kgCOD.m-3.d-1), phase II (day 91 through 180, with an OLR of 99 kgCOD. m-3.d-1), and phase III (day 181 through 270, with an OLR of 192 kgCOD.m-3.d-1). According to Fig. 2a, the TCOD of the influent increased in stages, which implied corresponding increases in OLR. In contrast, the SCOD of the influent tended to be slightly increased from phase I to phase III which confirmed the hydrolysis process. In the influent, the averages of the TCOD of phases I, II, and III were 188.7 g/L, 248.4 g/L, and 288.4 g/L, respectively, while the SCOD were 62.93 + 2.53 g/L, 60.07 + 3.14 g/L, and 60.30 + 2.94 g/L, respectively, due to the different batches used in this work. The relative increase in the TCOD were 31.6% and 53.0%, whereas the increases were only 13.2% and 20.7% for the effluent, respectively. In contrast, the relative SCOD increase in the influent from phase I to II, and phase I to III did not vary much (-4.15% for both). However, they were 2.1% and 5.3% for the effluent, respectively. In phase I, the TCOD of the effluent was higher than the TCOD of the influent because of excess TCOD from the inoculum (180 ± 15 g/L TCOD).
In phase II, the TCOD of the effluent was similar to the TCOD of the influent, whereas it was lower in phase III. This could be due the partial conversion of the TCOD into carbon dioxide and hydrogen via anaerobic hydrolysis and acidogenesis as the OLR increases. The microbes in the HR convert the organic compounds into volatile acids, as shown by the increase in the total VFAs. The major species of VFAs (as shown in Fig. 2b) were acetic acid (26%), followed by propionic acid (20.2%), butyric acid (17.4%), i-valeric acid (13.8%), valeric acid (12.1%), and i-butyric acid (10.6%). This finding was aligned with the results of Liu et al. (2006). All the VFAs gradually increased during phase I (from 0.4 g/L to 0.8 g/L) and plateaued in phase II (0.6 g/L to 0.7 g/L) before further increasing in phase III, from 0.7 g/L to 1.0 g/L. The higher the OLR, the greater the amount of VFAs. From this experiment, increasing the OLR enhanced the VFA conversion rate, however, with limitations. The VFAs content in phase I linearly increased from the beginning until the 90th day. Increasing the OLR from 57 kgCOD.m-3.d-1 to 98 kgCOD.m-3.d-1, however, did not lead to a higher VFA content than in phase I. It can be summarized that an OLR between 57 and 98 kgCOD.m-3.d-1 was acceptable in the HR in regard to the VFA production. In addition, it was considerably higher than the OLR given in Borja et al. (1996), which was 16.6 kgCOD.m-3.d-1.
As seen in Table 1, the TS of the POME was 33.6 g/L ± 0.2 g/L and consisted of 69.3% suspended solids. The VS (12.8 g/L ± 0.4 g/L) accounted for 38.1% of the TS, which may have been carbohydrates, fibers, sugars, proteins, and fats (Teoh and Mashitah 2010; Sinnaraprasat and Fongsatitkul 2011). These compounds can be converted to be monomers, e.g., volatile acids and fatty acids. The increasing VFA contents (Fig. 2b) was correlated to the decrease in the SS (Fig. 2c). The VS contents were relatively stable, however, so it can be reasoned that the SS changed to VS, i.e., VFAs. This was confirmed by the stable SCOD in the effluent of the HR. Generally, HR does not remove CODs but converts the polymers into monomers or simpler forms of organic compounds. However, considering the SS, it can be reasoned that the reducing the SS, i.e., fibers, changes them to VS, i.e., VFAs.
The hydrolysis ratio, interestingly, increased as the OLR increased. The hydrolysis ratio was quite scattered in phase I due to the starting up instability. The range of the hydrolysis ratio was between 11.7% to 60.0% (an average of 39.0% ± 13.3%). During phase II and phase III, the hydrolysis ratio was more stable, as well as considerably higher. The percentages increased in phase II to reach 87.1% 100.0% (an average of 98.4% ± 3.9%). The best hydrolysis ratio belonged to phase III and was equal to 100% for the entire period. The hydrolysis ratio confirmed the previous evidence that a higher OLR yielded greater degradation of complex compounds into simpler compounds, e.g., VFAs. The HR was very effective in converting organic compounds for easier uptake from the methanogens, which were poorly present in this reaction as confirmed by the very low methane content in the produced gas (1.65% ± 0.04%, 1.57% ± 0.1%, and 1.26% ± 0.02% in phase I, II, and III, respectively). Note that Liu et al. (2006) found no methane at an OLR of 53 kgCOD.m-3.d-1(or 37.5 kgVS.m-3.d-1) (HR) for a household-waste two stage anaerobic digester. Mamimin et al (2015) studied a two-stage anaerobic digester with thermophilic and then mesophilic reactors for POME treatment. At an OLR of 60 kgCOD.m-3.d-1 (similar to this study), they obtained a COD removal of 38%, which was 10% in our hydrolytic reactor (during phase III). This could be accounted to the higher temperature when compared with this work.
Anaerobic Membrane Bioreactor (AnMBR) Performance
Chemical oxygen demand (COD) removal
According to Fig. 3, the TCOD in the influent and permeate inclined to increase as the OLR increased.

Fig. 2. Performance of the hydrolysis reactors; a) TCOD, SCOD, and total VFA; b) VFAs and pH; and c) TS, VS, and TSS
The average COD removals were 74%, 66%, and 63% for phase I, phase II, and phase III, respectively. Hence, the increasing TCOD or OLR degraded the AnMBR performance following a slight linear trend, as shown in Fig. 3. The COD of the permeate (CODper) was high, i.e., 30 g/L, while the SCOD in the reactor and permeate tended to be stable even though it slightly increased from phase II to III. The CODper and SCOD showed the same stable pattern. Methanogenesis was itself very effective, with a 35% TCOD removal rate. The membrane filtration removed between 23.9% and 34.7% of the TCOD. The COD removal performance was supported by the physical process from the membrane filtration, which accounted for approximately 50% of the overall removal percentage during phase II and phase III. Hu et al (2017) presented a 2% to 21% increasing COD removal rate obtained from membrane filtration.
Stably controlling the pH at neutral pH conditions (7.35 to 7.83) for methanogens, increased the efficiency of the biogas yield (Yu et al. 2018). The COD balance in the AnMBR is presented in Fig. 4. The methanogenesis ratio in phase I (53.45%) and phase II (50.18%), were higher than in phase III (40.15%). These results agreed with the COD removal trends presented above. At the beginning of phase II, the COD removal rate gradually decreased and then sharply dropped after 135 d. In phase III, the COD removal and methanogenesis ratios were the lowest, probably due to overloading. The higher OLR was from the incomplete biodegradation of the VFA, which resulted in the hydrolysate being carried to the AnMBR. The increasing OLR in phase III explained the higher hydrolysis ratio (13%) compared to phase I and II (0.87% and 0.72%, respectively). The COD proportions in phase III showed that the acidogenesis ratio and methanogenesis ratio were limited by the residue hydrolysis ratio, as similarly observed by Cheng et al (2020).
Hence, the treatment of POME at a high OLR and high suspended solids content improved the COD removal via biological process and membrane filtration of the AnMBR (Mota et al. 2013; Cheng et al. 2020; Ariunbaatar et al. 2021; Chaipetch et al. 2021). However, the OLR should not exceed 50 kgCOD.m-3.d-1 to prevent process failure.

Fig. 3. The COD component in the AnMBR system and the COD removal performance

Fig. 4. COD mass balance for hydrolysis, acidogenesis, and methanogenesis ratio in the AnMBR
Volatile Fatty Acid (VFA) and Methane Yield
The average biogas production of the AnMBR in phases I, II, and III were 22.8 L/d, 28.5, and 21.2 L/d, respectively. The biogas production gradually increased in phase I and became more stable in phase II. In phase III, however, it slightly declined due to the higher OLR, which was responsible for the accumulation of VFAs in the system, as shown in Fig. 5. The average methane production increased from 15.4 L/d (66%) to 19.8 L/d (69%) from phase I to phase II. In phase III, the methane production decreased from 19.8 to 16.1 L/d (76%) with an OLR of 99 kg COD.m-3d-1. This result agreed with Cheng et al (2020), which increased the co-digestion of sewage sludge by adding food waste. This upgraded value was also attributed to the improved hydrolysis ratio. In this study the methane yield decreased due to the uncompleted hydrolysis of FOG (fat, oil, and grease) in POME presented as co-digestion from hydrolytic reactor when high OLR. The average methane production seemed to decrease as the VFA production rate increased and the COD removal decreased. The results agreed with previous studies even through the easily biodegradation wastewater such as sugarcane vinasse (Santos et al. 2017), food waste (Cheng et al. 2020), molasses (Wijekoon et al. 2011), etc. The decrease in the CH4 yield as the biogas production, which occurred as OLR increased, are probably due to a threshold VFA effect as the pH was controlled.
The major species of VFAs (as shown in Fig. 5b) were acetic acid (30.7%), followed by propionic acid (18.2%), butyric acid (15.3%), i-valeric acid (12.6%), valeric acid (12.4%), and i-butyric acid (10.8%). The VFA composition in this study was similar to the compositions found in previous studies (Voelklein et al. 2016; Krishnan et al. 2019). Their findings agreed with this study, i.e., acetic acid being the major component and butyric acid being the minor one, which both positively affected the biogas yield (p-value was less than or equal to 0.05). The acetic acid is easily transforming to methane, then presenting a positive effect. Propionic acid presented a negative impact on the biogas yield due the inhibition it causes to acetoclastic methanogens (Voelklein et al. 2016). As previously discussed, due to the high hydrolysis ratio in phase III, the VFA was limited at 600 mg/L because the large molecule and LC-VFA increased in the system. The VFA contents were not as high as the contents found in previous studies but were still high enough to negatively impact anaerobic degradation (Wijekoon et al. 2011; Chaikasem et al. 2014). The propionic acid to acetic acid ratio is a good indicator of approaching failure (Marchaim and Krause 1993). The ratio in this study was higher than 0.7, thus it limited the methane yield in the AnMBR. In addition, the failure of anaerobic degradation also affected the filtration performance, as shown by the higher COD and VFA in the permeate.

Fig. 5. VFA concentrations and methane yields in AnMBR
Filtration Performance
The internal recirculation and gas sparging were set to prevent fouling due to the high OLRs and high solids contents. In phases I, II, and III, the flux was obtained at 2.00, 2.04, and 2.02 LMH, respectively, which was similar to a previous study by the authors (Chaipetch et al. 2021). The average MLSS concentrations in each phase were between 36.7 g/L to 39.5 g/L. The concentrations of biomass decreased during operation. The fouling rate sharply increased in phase I (0.15 kPa/d to 0.19 kPa/d). In phase II and phase III, the fouling rate gradually increased (0.18 kPa/d to 0.22 kPa/d), as shown in Fig. 6. In addition, the fouling rate suddenly increased at the beginning of each phase and stayed constant until the end of operation. The protein concentrations in the supernatant were 6.4, 6.7, and 7.3 g/L for phases I, II, and III, respectively. The polysaccharide concentrations in the supernatant were 9.7, 11.2, and 11.4 g/L for phases I, II, and III, respectively.
These results indicated that polysaccharides leached in the supernatant more easily than proteins. Moreover, the high molecular weight of proteins makes them difficult to degrade, so they can attach to the membrane surface and cause fouling. In this study, the SMP followed the same trend as the fouling rate. The statistical analysis confirmed the impact of all parameters in AnMBR (protein, polysaccharide, MLSS, SCOD, TCOD and VFA) on the fouling rate. The results showed the impact of those parameters on the fouling rate as follows: in phase I, the statistical analysis showed that only the MLSS significantly affected the fouling rate (a R2 of 0.50 and a p-value of less than or equal to 0.05). In phase II, the statistical analysis indicated that only the polysaccharide concentration significantly affected the fouling rate (a R2 of 0.50 and a p-value of less than or equal to 0.05). In phase III, both the protein and VFA concentrations were found to significantly affect the fouling rate (a R2 of 0.70 and a -value of less than or equal to 0.05).

Fig. 6. The fouling rate and SMP concentration in AnMBR
From these statistical results, phase I presented the highest MLSS concentration, although it gradually decreased due to the removal of the membrane for cleaning. In phase II, almost all the polysaccharides detached from the extracellular polymeric substances (EPS), which caused the increased fouling rate (Chaipetch et al. 2021). The VFAs in the reactor were not measured in phase III. However, the VFAs in the permeate were measured and their concentration were similar to the HR effluent. This point could be presented as evidence of VFAs in the AnMBR. It could imply a high VFA concentration in the AnMBR, which inhibited the anaerobic degradation and induced the increased fouling rate.
These results are aligned with the research presented by Mota et al. (2013). The bulk solution of a high loading in the AnMBR was fouled by protein-like substances, which were released by the acidogens or operated at high VFA conditions. It seems that the AnMBR was unstable, as shown by the high concentration of VFAs and SMP (proteins and polysaccharides that are metabolic products of the microbes under inappropriate environment). This was supported by the high concentration of SCOD and VFAs in the permeate in phase III and presented a linear correlation. Phenol inhibition was reported in previous studies (Chantho et al. 2016; Rea et al. 2020; Sierra et al. 2017). In this study, the phenol contents in the POME and HR were 258 mg/L and 263 mg/L, respectively. The phenol contents in the permeate were 8.5 mg/L and 5.2 mg/L in phase I and II, respectively. Several studies have reported the low AD performances of wastewater treatment with high phenol and phenolic compounds (Hernandez and Edyvean 2005; Pradeep et al. 2015; Chantho et al. 2016; Muñoz et al. 2017). the anaerobic membrane bioreactors (AnMBR) present seeking solutions for this inhibiting compound (Smith et al. 2014; Shin and Bae 2018).
Therefore, it can be concluded that phenols were not inhibiting the HR and AnMBR process because the concentration was lower than the critical value reported by Mamimin et al. (2012) and equal to 400 mg/L. However, the phenol in the permeate in phase III was equal to 258 mg/L, which was the same as the POME concentration, which indicated an inhibitor effect, according to VFA accumulation in the system. High VFAs probably inhibited the activity of anaerobes, which affects phenol degradation as well. The results of phenol rejection were small because its molecular weight cut-off (MWCO) was smaller than the membrane pore size. Hence, it is a biological process that removes a considerable portion of the phenols rather than the membrane filtration.
CONCLUSIONS
- The treatment of palm oil mill effluent (POME) at a high organic loading rates (OLR) via a two-stage anionic membrane bioreactor (AnMBR) presented suitable potential for renewable energy production. The higher the OLRs, the greater the volatile fatty acids (VFA). The chemical oxygen demand (COD) removal performance was 70% higher for the coupling process, i.e., the biological process and membrane filtration. The membrane filtration added a further 23.9% to 34.7% COD removal rate.
- The AnMBR has the potential to produce a relevant effluent for fertilizer issue, which can be readily concentrated by membrane process.
- An OLR higher than 50 kgCOD.m-3.d-1 induced an accumulation of VFAs, which inhibited the methanogenic activity in the AnMBR in favour of a higher hydrolysis ratio. The ratio of propanoic acid to acetic acid was higher than 0.7, which indicated an approaching anaerobic failure.
- The MLSS, protein, polysaccharide and VFA contents were the significant observed parameters that influenced the fouling rate.
ACKNOWLEDGMENTS
The research was financially supported by the Thailand Research Fund (TRF) and Tha Chang Palm Oil Industries, Co., Ltd. through a Research and Researcher for industries (RRi) under contract number “PHD58I0056”. It was also bilaterally financially supported by the government budget of Prince of Songkla University, under the Integrated Research and Innovation Program 2019, contract number “ENG6201004S”.
REFERENCES CITED
Ariunbaatar, J., Bair, R., Ozcan, O., Ravishankar, H., Esposito, G., Lens, P. N. L., and Yeh, D. H. (2021). “Performance of AnMBR in treatment of post-consumer food waste: Effect of hydraulic retention time and organic loading rate on biogas production and membrane fouling,” Frontiers in Bioengineering and Biotechnology 8, 1-15. DOI: 10.3389/fbioe.2020.594936
AWWA (2012). Standard Methods for Examination of Water and Wastewater, American Public Health Association, American Water Works Association, and Water Environment Federation, Washington, DC, Denver, CO., and Alexandria, VA.
Aziz, N. I. H. A., and Hanafiah, M. M. (2017). “The potential of palm oil mill effluent (POME) as a renewable energy source,” Acta Scientifica Malaysia 1(2), 9-11. DOI: 10.26480/asm.02.2017.09.11
Borja, R., Banks, C. J., and Sánchez, E. (1996). “Anaerobic treatment of palm oil mill effluent in a two-stage up-flow anaerobic sludge blanket (UASB) system,” Journal of Biotechnology 45(2), 125-135. DOI: 10.1016/0168-1656(95)00154-9
Chaikasem, S., Abeynayaka, A., and Visvanathan, C. (2014). “Effect of polyvinyl alcohol hydrogel as a biocarrier on volatile fatty acids production of a two-stage thermophilic anaerobic membrane bioreactor,” Bioresource Technology 168, 100-105. DOI: 10.1016/j.biortech.2014.04.023
Chaipetch, W., Jaiyu, A., Jutaporn, P., Heran, M., and Khongnakorn, W. (2021). “Fouling behavior in a high-rate anaerobic submerged membrane bioreactor (AnMBR) for palm oil mill effluent,” Membranes 11(9), 1-15. DOI: 10.3390/membranes11090649
Chantho, P., Musikavong, C., and Suttinun, O. (2016). “Removal of phenolic compounds from palm oil mill effluent by thermophilic Bacillus thermoleovorans strain A2 and their effect on anaerobic digestion,” International Biodeterioration and Biodegradation 115, 293-301. DOI: 10.1016/j.ibiod.2016.09.010
Cheng, H., Li, Y., Guo, G., Zhang, T., Qin, Y., Hao, T., and Li, Y.-Y. (2020). “Advanced methanogenic performance and fouling mechanism investigation of a high-solid anaerobic membrane bioreactor (AnMBR) for the co-digestion of food waste and sewage sludge,” Water Research 187, 1-13. DOI: 10.1016/j.watres.2020.116436
Hasanudin, U., Sugiharto, R., Haryanto, A., Setiadi, T., and Fujie, K. (2015). “Palm oil mill effluent treatment and utilization to ensure the sustainability of palm oil industries,” Water Science and Technology 72(7), 1089-1095. DOI: 10.2166/wst.2015.311
Hernandez, J. E., and Edyvean, R. G. (2005). “Anaerobic treatment of phenol in a two-stage anaerobic reactor,” in: Proceedings of the 7th World Congress of Chemical Engineering: Engineering for Life Incorporating the 5th European Congress, 10-14 July, Glasgow, England, pp. 1-9.
Hu, D., Tian, Y., Wang, Z., Wu, P., Wang, P., Chen, Z., Cui, Y., and Ge, H. (2017). “The operational efficiency of a novel AnMBR treating antibiotic solvent wastewater in start-up stage,” Journal of Water Reuse and Desalination 7(3), 326-337. DOI: 10.2166/wrd.2016.064
Khan, M. A., Ngo, H. H., Guo, W., Chang, S. W., Nguyen, D. D., Varjani, S., Liu, Y., Deng, L., and Cheng, C. (2019). “Selective production of volatile fatty acids at different pH in an anaerobic membrane bioreactor,” Bioresource Technology 283, 120-128. DOI: 10.1016/j.biortech.2019.03.073
Krishnan, S., Din, M. F. M., Taib, S. M., Nasrullah, M., Sakinah, M., Wahid, Z. A., Kamyab, H., Chelliapan, S., Rezania, S., and Singh, L. (2019). “Accelerated two-stage bioprocess for hydrogen and methane production from palm oil mill effluent using continuous stirred tank reactor and microbial electrolysis cell,” Journal of Cleaner Production 229, 84-93. DOI: 10.1016/j.jclepro.2019.04.365
Li, L., Kong, Z., Xue, Y., Wang, T., Kato, H., and Li, Y.-Y. (2020). “A comparative long-term operation using up-flow anaerobic sludge blanket (UASB) and anaerobic membrane bioreactor (AnMBR) for the upgrading of anaerobic treatment of N, N-dimethylformamide-containing wastewater,” Science of the Total Environment 699, 1-9. DOI: 10.1016/j.scitotenv.2019.134370
Liu, D., Liu, D., Zeng, R. J., and Angelidaki, I. (2006). “Hydrogen and methane production from household solid waste in the two-stage fermentation process,” Water Research 40(11), 2230-2236. DOI: 10.1016/J.WATRES.2006.03.029
Mamimin, C., Singkhala, A., Kongjan, P., Suraraksa, B., Prasertsan, P., Imai, T., and O-Thong, S. (2015). “Two-stage thermophilic fermentation and mesophilic methanogen process for biohythane production from palm oil mill effluent,” International Journal of Hydrogen Energy 40(19), 6319-6328. DOI: 10.1016/j.ijhydene.2015.03.068
Mamimin, C., Thongdumyu, P., Hniman, A., Prasertsan, P., Imai, T., and O-Thong, S. (2012). “Simultaneous thermophilic hydrogen production and phenol removal from palm oil mill effluent by Thermoanaerobacterium-rich sludge,” International Journal of Hydrogen Energy 37(20), 15598-15606. DOI: 10.1016/j.ijhydene.2012.04.062
Marchaim, U., and Krause, C. (1993). “Propionic to acetic acid ratios in overloaded anaerobic digestion,” Bioresource Technology 43(3), 195-203. DOI: 10.1016/0960-8524(93)90031-6
Mota, V. T., Santos, F. S., and Amaral, M. C. S. (2013). “Two-stage anaerobic membrane bioreactor for the treatment of sugarcane vinasse: Assessment on biological activity and filtration performance,” Bioresource Technology 146, 494-503. DOI: 10.1016/j.biortech.2013.07.110
Navarrete, R. P. (2020). A Statistical Approach to Link Flux and Fouling to Sludge Characteristics for an Anaerobic Membrane Bioreactor Treating Dairy Cheese Wastewater, Master’s Thesis, Delft University of Technology, Delft, Netherlands.
Pradeep, N. V., Anupama, S., Navya, K., Shalini, H. N., Idris, M., and Hampannavar, U. S. (2015). “Biological removal of phenol from wastewaters: A mini review,” Applied Water Science 5(2), 105-112. DOI: 10.1007/s13201-014-0176-8
Qiao, W., Takayanagi, K., Niu, Q., Shofie, M., and Li, Y. Y. (2013). “Long-term stability of thermophilic co-digestion submerged anaerobic membrane reactor encountering high organic loading rate, persistent propionate and detectable hydrogen in biogas,” Bioresource Technology 149, 92-102. DOI: 10.1016/j.biortech.2013.09.023
Rea, V. S. G., Sierra, J. D. M., Aponte, L. M. F., Cerqueda-Garcia, D., Quchani, K. M., Spanjers, H., and Lier, J. B. v. (2020). “Enhancing phenol conversion rates in saline anaerobic membrane bioreactor using acetate and butyrate as additional carbon and energy sources,” Frontiers in Microbiology 11, 1-16. DOI: 10.3389/fmicb.2020.604173
Santos, F. S., Ricci, B. C., Neta, L. S. F., and Amaral, M. C. S. (2017). “Sugarcane vinasse treatment by two-stage anaerobic membrane bioreactor: Effect of hydraulic retention time on changes in efficiency, biogas production and membrane fouling,” Bioresource Technology 245, 342-350. DOI: 10.1016/j.biortech.2017.08.126
Serna-García, R., Zamorano-López, N., Seco, A., and Bouzas, A. (2020). “Co-digestion of harvested microalgae and primary sludge in a mesophilic anaerobic membrane bioreactor (AnMBR): Methane potential and microbial diversity,” Bioresource Technology 298, 1-9. DOI: 10.1016/j.biortech.2019.122521
Shin, C., and Bae, J. (2018). “Current status of the pilot-scale anaerobic membrane bioreactor treatments of domestic wastewaters: A critical review,” Bioresource Technology 247, 1038-1046. DOI: 10.1016/j.biortech.2017.09.002
Sierra, J. D. M., Lafita, C., Gabaldón, C., Spanjers, H., and Lier, J. B. v. (2017). “Trace metals supplementation in anaerobic membrane bioreactors treating highly saline phenolic wastewater,” Bioresource Technology 234, 106-114. DOI: 10.1016/j.biortech.2017.03.032
Sinnaraprasat, S., and Fongsatitkul, P. (2011). “Optimal condition of Fenton’s reagent to enhance the alcohol production from palm oil mill effluent (POME),” EnvironmentAsia 4(2), 9-16. DOI: 10.14456/EA.2011.12
Smith, A. L., Stadler, L. B., Cao, L., Love, N. G., Raskin, L., and Skerlos, S. J. (2014). “Navigating wastewater energy recovery strategies: A life cycle comparison of anaerobic membrane bioreactor and conventional treatment systems with anaerobic digestion,” Environmental Science and Technology 48(10), 5972-5981. DOI: 10.1021/es5006169
Teng, T. T., Wong, Y.-S., Ong, S.-A., Norhashimah, M., and Rafatullah, M. (2013). “Start-up operation of anaerobic degradation process for palm oil mill effluent in anaerobic bench scale reactor (ABSR),” Procedia Environmental Sciences 18, 442-450. DOI: 10.1016/j.proenv.2013.04.059
Teoh, Y. P., and Mashitah, M. D. (2010). “Cellulase production by pycnoporus sanguineus on oil palm residues through pretreatment and optimization study,” Journal of Applied Sciences 10(12), 1036-1043. DOI: 10.3923/JAS.2010.1036.1043
Voelklein, M. A., Rusmanis, D., and Murphy, J. D. (2016). “Increased loading rates and specific methane yields facilitated by digesting grass silage at thermophilic rather than mesophilic temperatures,” Bioresource Technology 216, 486-493. DOI: 10.1016/j.biortech.2016.05.109
Wijekoon, K. C., Visvanathan, C., and Abeynayaka, A. (2011). “Effect of organic loading rate on VFA production, organic matter removal and microbial activity of a two-stage thermophilic anaerobic membrane bioreactor,” Bioresource Technology 102(9), 5353-5360. DOI: 10.1016/j.biortech.2010.12.081
Yu, D., Meng, X., Liu, J., Dian, L., Sui, Q., Zhang, J., Zhong, H., and Wei, Y. (2018). “Formation and characteristics of a ternary pH buffer system for in-situ biogas upgrading in two-phase anaerobic membrane bioreactor treating starch wastewater,” Bioresource Technology 269, 57-66. DOI: 10.1016/j.biortech.2018.08.072
Article submitted: December 1, 2021; Peer review completed: January 15, 2022; Revised version received and accepted: April 13, 2022; Published: April 29, 2022.
DOI: 10.15376/biores.17.2.3398-3412