
Abstract
Regression models and a neural net approach were used to predict the cutting performance during milling of Scots pine (Pinus sylvestris L.) by shank cutter. The influence of rake angle, spindle speed, and milling depth on surface roughness of the workpiece, as well as the connection between the milling force and the surface roughness, were thoroughly considered. Four approaches were used to predict the workpiece’s surface roughness based on the experimental data: Back Propagation Neural Network (BPNN), Radial Basis Function Neural Network (RBFNN), Support Vector Machines (SVM), and multiple linear regression. The comparative analysis of the predictive models showed that Neural Network (NN) had preferable performance for prediction of machined surface roughness, with an R2 of 0.98. The SVM had certain fluctuations and the R2 of the multiple linear regression was just 0.87, indicating that they did not fit well for prediction machined surface roughness. In summary, the effective trend of milling parameters on the machined surface roughness of Scots pine was similar to multiple nonlinear regression, and the accurate prediction by BPNN model can provide technical support for the surface roughness of the Scots Pine and enhance shank cutter performance.
Download PDF
Full Article
Prediction of Straight Tooth Milling of Scots Pine Wood by Shank Cutter Based on Neural Net Computations and Regression Analysis
Jiali Gu and Pingxiang Cao *
Regression models and a neural net approach were used to predict the cutting performance during milling of Scots pine (Pinus sylvestris L.) by shank cutter. The influence of rake angle, spindle speed, and milling depth on surface roughness of the workpiece, as well as the connection between the milling force and the surface roughness, were thoroughly considered. Four approaches were used to predict the workpiece’s surface roughness based on the experimental data: Back Propagation Neural Network (BPNN), Radial Basis Function Neural Network (RBFNN), Support Vector Machines (SVM), and multiple linear regression. The comparative analysis of the predictive models showed that Neural Network (NN) had preferable performance for prediction of machined surface roughness, with an R2 of 0.98. The SVM had certain fluctuations and the R2 of the multiple linear regression was just 0.87, indicating that they did not fit well for prediction machined surface roughness. In summary, the effective trend of milling parameters on the machined surface roughness of Scots pine was similar to multiple nonlinear regression, and the accurate prediction by BPNN model can provide technical support for the surface roughness of the Scots Pine and enhance shank cutter performance.
DOI: 10.15376/biores.17.2.2003-2019
Keywords: Scots pine; Straight tooth milling; Surface roughness; NN; SVM; Multiple linear regression
Contact information: College of Materials Science and Engineering, Nanjing Forestry University, 210037, Jiangsu, China; *Corresponding author: njfucpx@163.com
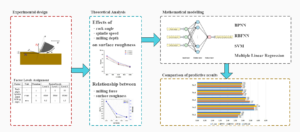
GRAPHICAL ABSTRACT
INTRODUCTION
Scots pine is a type of softwood that grows in many places of the world. It usually has a light yellowish color and a broad texture pattern (Zhong et al. 2013). It also has low processing energy consumption, natural degradation, and suitability for recycling (Tu et al. 2018). As a typical material with heterogeneity and anisotropy, Scots pine is distinctive relative to other wood species (Eyma et al. 2004). The properties and strength vary in different directions (Guo et al. 2021). In the field of wood cutting mode, milling is one of the most widely used cutting methods. The spindle speed of the milling cutter is generally above 3000 r/min and up to 24000 r/min (Zheng et al. 2008). High-speed milling enables wood processing with high productivity and smooth surface quality (Darmawan et al. 2001; Byrne et al. 2003; Guo et al. 2021).
The selection of milling cutters mainly includes the technical parameters (Vančo et al. 2017), the structure (Keturakis and Bendikiene 2016), the direction of rotation (Chen et al. 2012), the cutting amount (Luo 2007), and the stable operation of the milling cutter (Sofuoğlu 2019). The shank cutter is a type of milling cutter that has a small diameter with high rotational speed to reach high productivity (Guo et al. 2014).
In wood manufacturing, the surface roughness significantly impacts the sealing performance (Liu et al. 2018), painting (Zhang et al. 2015), surface decoration quality (Sogutlu et al. 2017), adhesive usage (Rudawska et al. 2016), and paint consumption (Zhu et al. 2018), so it is an important index to evaluate the surface quality of wood products. Moreover, the surface roughness of wooden parts was found to directly affect the arrangement of the processing technology and the setting of the processing allowance. Guo et al. (2015) studied the wood floor/PVC machinability of composite material. These authors concluded that the roughness of the machined surface increased as the depth of milling increased. MalkoҫOğLu (2007) measured the surface roughness of Scots pine and indicated that the rake angle affected the surface roughness of the wood, and the effect of the feed speed on the surface roughness was negligible.
As technology advances, the emergence of some mathematical models also provides reference and contrast for physical experimental analysis. In the existing analysis technology of the cutting performance of wood products, Tiryaki et al. (2014) used artificial neural networks to model the type of wood, the number of cuts, the feed speed, the depth of cut, and the early and fall wood. The conclusion was that the model of wood surface roughness was reliable and valuable. Dong et al. (2021) proposed a tool wear status monitoring method based on wavelet transform and genetic-BP neural network. Valarmathi et al. (2015) used response surface methodology to establish a mathematical model that predicted the influence of input control parameters on the cutting force generated during the medium density fiberboard (MDF) drilling. Yue et al. (2017) developed serials of 3D FEM models for the corner milling process based on DEFORM software. Tool curved trajectory was achieved by tool location with milling time, and the results provided a guide for optimizing cutting parameters in the cutting process. Analysis of variance was used to test the adequacy of the model. Although there have been some successes in predicting automation for analyzing wood cutting performance, the accuracy of predicting these parameters used to evaluate cutting performance needs to be improved and the prediction of surface roughness needs to be studied, which will serve as a reference for improving wood quality.
In this paper, multiple milling parameters were used to explore the machined surface quality of Scots pine by shank cutter with a single tooth. The effects of rake angle, spindle speed, and milling depth on the surface roughness of the workpiece, as well as the connection between the milling force and the surface roughness, were thoroughly analyzed. Based on the experimental data, four different computational approaches were utilized to predict the workpiece’s surface roughness. The performances of the four approaches were compared and examined in order to provide a reliable prediction model for Scots pine straight-tooth milling.
EXPERIMENTAL
Materials
The milling experiments were carried out on a computerized numerical control (CNC) processing center (MGK01, Nanxing Machinery Co., Ltd., Guangzhou, China) with an 18 mm diameter shank cutter. The shank cutter (Fig. 1) in the milling process with a single tooth which was made of cemented carbide. The angle geometries and mechanical properties are shown in Table 1. The tool rake angles of 2°, 6°, and 10° were selected in the experiments because the smaller rake angle provided stable milling force and made the tool more durable. The workpiece was made from Scots pine. The size was 120×80×12 (length×width×thickness) mm, and the feed speed during machining was fixed at 5 m/min.

Fig. 1. Cutting diagram
Table 1. Rake Angles and Mechanical Properties of Shank Cutter Tooth

Experimental Design
The milling force Fx is parallel to feed rate U, and Fy is perpendicular to the direction of feed rate U. The milling forces were measured by Kistler dynamometer (9257B, Kistler Group, Winterthur, Switzerland) equipped with a sensor and a charge amplifier. In the straight tooth milling process, the workpiece would be fixed by the fixture in actual production. The Fz component of force was weak and was assumed not have an influence on milling performance, and it was not considered. The software of Dynoware (Kistler 5070A amplifier, 3.2.0.0, Kistler Group, Winterthur, Switzerland) was used to measure the milling force in the process. Each milling parameters will be performed eight times, and the measured Fx and Fy values were selected from last five times out of eight times and calculated as the absolute maximum of each time. The milling parameters selected in the experiment are shown in Table 2.
Table 2. Factor Levels Assignment

The horizontal tracking surface roughness of the machined workpiece was measured by a precision surface roughness profiler (SURFCOM NEX, Zeiss, Oberkochen, Germany) with a probe head. The surface roughness under each group of milling parameters was measured five times. The data for Ra were the averages calculated after removing the maximum and minimum values five times.
In the experiment, 27 groups of data under 3 milling parameters were conducted. Rake angle, spindle speed, and milling depth were the independent variables. The milling force in two directions and the surface roughness were the dependent variables. The surface roughness was a significant signal for evaluating the surface quality of Scots pine, and the resultant milling force function was as stated in Eq. 1.
 (1)
(1)
RESULTS AND DISCUSSION
Effect of Rake Angle on Surface Roughness
In the milling process, the tool rake angle had a significant influence on the machined surface roughness. Individual value graphs of surface roughness vs. rake angle are shown in Fig. 2. The workpiece surface roughness decreased when the rake angle was raised. The reason for this was that the shank cutter’s extrusion and friction on the chip’s front face were reduced, resulting in less chip plastic deformation. As a result, the stiffness damage on the machined surface decreased, and the surface quality increased.

Fig. 2. Effects of rake angle on the surface roughness of workpiece
Effect of Spindle Speed on Surface Roughness
The effects of workpiece surface roughness with different spindle speeds are shown in Fig. 3. The rake angles of 2°, 6°, and 10° are indicated in the three columns from left to right. The results revealed that when the spindle speed increased, the surface roughness of the machined workpiece was reduced. The reason was that when the spindle speed increased, the average milling amount reduced. The impulsive load was lowered, which had an additional impact on the blade load and vibration. More crucially, within a given range (6000 to 10000 r/min), the spindle speed was the key factor of three (rake angle, spindle speed and milling depth) related to variations in surface roughness. As a result, increasing the spindle speed enhanced the quality of the machined surface dramatically. However, with the same machining allowance, it would increase the number of milling rotations, causing the wear of milling edges to accelerate.

Fig. 3. Effects of spindle speed on the surface roughness of workpiece: (a) γ = 2°, (b) γ = 6°, and (c) γ = 10°
Effect of Milling Depth on Surface Roughness
The milling depth also had an influence on the surface roughness of the workpiece while milling with a shank cutter. The machined surface roughness increased with the average milling depth when the tool angle was constant, as illustrated in Fig. 4. The primary reason was that the quantity of milling per tooth increased, as did the length and thickness of the chips.
It should be noted that when the spindle speed was set to 10000 r/min, the roughness changes with increasing milling depth were not obvious. This was mostly due to the high temperature in the milling zone at this speed (Umut and Erhan 2018), which exacerbated the workpiece’s softening impact. As a result, if high-speed milling was used and the workpiece’s surface quality met the criteria, the production efficiency could be enhanced by increasing the milling depth. However, it could not be increased arbitrarily, which would result in decreased tool life.

Fig. 4. Effects of milling depth on the surface roughness of workpiece: (a) γ = 2°, (b) γ = 6°, and (c) γ = 10°
Relationship between Milling Force and Surface Roughness
According to the above analysis, it was concluded that the fluctuation range of the spindle speed had a greater effect on the workpiece surface roughness than the other two parameters. Figure 5 displays the changing trend between the resultant milling force Fc and surface roughness Ra under the conditions that when γ = 2°, 6°, 10° and h = 0.5 mm, 1 mm and 1.5 mm. It was concluded that the resultant milling force had a good correlation with the surface roughness. They both decreased when the spindle speed was increased. As a result, the workpiece’s surface quality improved. It was mainly because the rake face of the shank cutter made it simpler to separate the chips from the milling surface of the workpiece as the spindle speed increased. The surface groove markings were trimmed back and the friction between the rake face and the workpiece was minimized.


Fig. 5. Relationship between the resultant milling force and surface roughness: (a) γ = 2°, h = 0.5 mm, (b) γ = 2°, h=1 mm, (c) γ = 2°, h = 1.5 mm, (d) γ = 2°, h = 0.5 mm, (e) γ = 6°, h = 1 mm, (f) γ = 10°, h = 1.5 mm, (g) γ = 2°, h = 0.5 mm, (h) γ = 6°, h = 1 mm, and (i) γ = 10°, h = 1.5 mm
PREDICTION AND VALIDATION OF COMPUTATIONS
Data Pre-processing
Due to the complexity and random nature in the milling process of Scots pine with shank cutter, methods of achieving suitable surface roughness should be involved in the prediction. Regression models have been extensively applied in the field of wood processing because of their ability to extract features from complicated factors and detect patterns.
The data pre-processing was necessary for prediction of regression models and for neural net computations. The machining variables (including the rake angle, spindle speed, and milling depth) were measured in different units and dimensions, which influenced the data analysis findings. As a result, the normalization procedure should be carried out between the variables in order to increase the stability and performance of regression models (Liu et al. 2020). Equation 2 depicts the normalizing procedure,
 (2)
(2)

Modeling of Surface Roughness Based on Milling Parameters
Nonlinear and linear regression models were included in the computational approaches. Nonlinear computational approaches with properties of optimum and global approximation, such as back propagation neural network (BPNN), radial basis function neural network (RBFNN), and support vector machines (SVM), have been frequently used to predict milling processes. Multiple and univariate linear regression were used in the linear regression models. Three types of computational approaches (NN, SVM, and multiple linear regression) were employed to predict surface roughness during the milling of Scots Pine with a shank cutter in this paper. In addition, the accuracy of nonlinear and linear regression was also compared.
BPNN Modeling
The BPNN is a multilayer feed-forward network that uses the error back propagation method to cope with nonlinear and complicated systems (Zhang et al. 2018). The BPNN adopts the Sigmoid function for the global approximation of nonlinear mapping (Cui and Xiang 2018). The structure of BPNN in this paper is shown in Fig. 6, and the Sigmoid function can be formulated as Eq. 3,
 (3)
(3)

Forward propagation

 (4)
(4)
 (5)
(5)


Fig. 6. Topological structure of three-layer BPNN
Back propagation
The back propagation of errors means that the output is transmitted back to the input layer through the hidden layer. The error is allocated to all neural units in each layer, allowing the weights of each layer’s neural units to be adjusted to reduce the error along the gradient (Zhao et al. 2008).
RBFNN Modeling
In common with BPNN, the RBFNN is also a typical nonlinear multilayer feedforward NN. The distinction is that RBFNN adopts radial basis functions (such as Gaussian function) for the local nonlinear mapping approximation (Sun et al. 2019). Therefore, the RBFNN has the characteristics of fast learning speed and strong adaptability. The construction of RBFNN in this paper was comparable to that of BPNN, as showed in Fig. 6.
In RBFNN, the output of the hidden and output layer is given in Eqs. 6 and 7.
 (6)
(6)
 (7)
(7)
 The graph of the RBFNN function is radially symmetric and decaying on both sides. When the specified center is relatively near to the input data, the mapping on the input works. On the other hand, if the center is far away from the input data, the output of result tends to zero, making it a local approximation (Guillén et al. 2009).
SVM Modeling
Compared with NN, the SVM does not have hidden layer and neurons. The SVM conducts classification by creating an N-dimensional hyperplane that divides the input into two groups as efficiently as possible (Cho et al. 2005). The SVM adopts a kernel function to perform nonlinear mapping to high-dimensional space (Li et al. 2013), so it is well-suited to problems that are fundamentally nonlinear, such as classification, regression, and density function estimation.
Given the mapping to high-dimensional space, the model corresponding to dividing the hyperplane in this feature space is expressed in Eq. 8,
 (8)
(8)

 (9)
(9)

 (10)
(10)

Multiple Linear Regression Modeling
To comprehensively consider the unknown function model about the impacts of milling parameters on surface roughness, it is necessary to perform multiple linear regression analysis on it.
The model of multiple linear regression can be formulated as Eq. 11 (Wang et al. 2006),
 (11)
(11)

Comparison of Different Predictive Methods

 (12)
(12)


Fig. 7. The predictive results of surface roughness by the models
Table 3. Evaluation Criteria for Predictive Results of Models

Table 3 shows that the MAP of the 5 groups was kept to less than 4%, and the BPNN model was relatively minimal. Additionally, SVM and multiple linear regression errors were more than twice as large as NN’s. The experimental surface roughness of No.1 was 2.86 µm, and the SVM and multiple linear regression prediction values were 2.69 µm and 2.68 µm, respectively, as shown in Fig. 7. The data discrepancy between experimental and predicted surface roughness of SVM, multiple linear regression is similarly considerable in the No. 3 group. As a result, the inaccuracy of prediction was caused by the two groups. Based on the relative errors, the construction of the NN was more accurate and effective for the fitting analysis of the surface roughness model than other two models.
Furthermore, in analysis of peformance among 4 models, the mean square error (MSE) and goodness of fit (R2) were used as evaluation criteria. The MSE reflected the degree of difference between the predictive value and exprimental value and could be expressed as Eq. 13,
 (13)
(13)
where is the number of output nodes, is the number of training samples, and and are the predictive output and experimental output, respectively.
The R2 described how well it fit a set of observations. The maximum value of R2 was 1. The closer the value of R2 was to 1, the better the fit of the regression to the tested values. On the contrary, the smaller the value of R2, the worse the fit of the regression to the tested values. For multiple nonlinear regression and multiple linear regression, the R2 was expressed as Eqs. 14 and 15 (Gharagheizi 2007), respectively.
 (14)
(14)
 (15)
(15)
In these equations, and are the experimental and predictive output, and is the average of experimental output.
According to the results of MSE and R2 in Table 4, it should be noted that the performance result of NN was perfect among the four computational approaches, with the R2 of 0.98. In particular, the fitting process of BPNN was the most stable, with the MSE of 0.0114. There were certain fluctuations during the fitting process of SVM. The R2 of the multiple linear regression was just 0.87, indicating that it did not fit well. In summary, the effective trend of milling parameters on the surface roughness of Scots pine during the milling process was similar to multiple nonlinear regression, and NN was an effective method for prediction.
CONCLUSIONS
In this paper, multiple milling settings for straight tooth milling of Scots pine were specified. The study’s limitations were that only the rake angle, spindle speed, and milling depth were used to assess the workpiece’s surface quality. Other tool parameters’ effects on the workpiece were not taken into account. After theoretical analysis, four types of computational approach were employed to predict surface roughness by considering the above parameters, with the following conclusions:
- The theoretical analysis based on the main effects revealed that all the milling parameters had the main influence on the surface roughness of Scots pine. The workpiece surface roughness rose as the rake angle and milling depth increased, but they decreased as spindle speed increased.
- Good concurrence was found between the milling force and surface roughness. They both increased with the increase of the milling depth but were negatively correlated with the spindle speed and tool rake angle.
- The surface roughness results from the models (BPNN, RBFNN, SVM and multiple linear regression) illustrated that the predictive accuracy of the BPNN was relatively minimal, with the MAP of 1.02%.
- NN had the best performance of the four computational approaches, with an R2 of 0.98. In particular, the fitting process of BPNN was the most stable, with a MSE of 0.0114. By using the model of SVM, the R2 and MSE were not very good, compared with NN model. The surface roughness prediction model of straight tooth milling Scots pine was not suitable for linear regression analysis, which R2 was just 0.87.
Funding
This study was funded by the Efficient Processing Technology for Unusual and Low-grade Wood (supported by Science and Technology) (Grant No. 011020267).
Availability of Data and Materials
The datasets generated and analyzed during the current study are available from the corresponding author on request.
Ethics Approval
No studies involving humans or animals are included in this article.
Competing Interests
The authors declare that they have no conflict of interest.
REFERENCES CITED
Byrne, G., Dornfeld, D., and Denkena B. (2003). “Advancing cutting technology,” CIRP Annals 52(2), 483-507. DOI: 10.1016/S0007-8506(07)60200-5
Chen, D., Satran, A., and Ziebenberg, A. (2012). “Tangential cutting insert and milling cutter,” U. S. Patent No. 20120195700A1.
Cho, S., Asfour, S., Onar, A., and Kaundinya, N. (2005). “Tool breakage detection using support vector machine learning in a milling process,” International Journal of Machine Tools and Manufacture, 45(3), 241-249. DOI: 10.1016/j.ijmachtools.2004.08.016
Cui, K., and Xiang, J. (2018). “Research on prediction model of geotechnical parameters based on BP neural network,” Neural Computing and Applications 31(14), 8205 -8215. DOI: 10.1007/s00521-018-3902-6
Darmawan, W., Tanaka, C., Usuki, H., and Ohtani, T. (2001). “Performance of coated carbide tools when grooving wood-based materials: Effect of work materials and coating materials on the wear resistance of coated carbide tools,” Journal of Wood Science 47(2), 94-101. DOI: 10.1007/BF00780556
Dong, W., Guo, X., Hu, Y., Wang, J., and Tian, G. (2021). “Discrete wavelet transformation and genetic algorithm – Back propagation neural network applied in monitoring woodworking tool wear conditions in the milling operation spindle power signals,” BioResources 16(2), 2369-2384. DOI: 10.15376/biores.16.2.2369-2384
Eyma, F., Méausoone, P., and Martin, P. (2004). “Strains and cutting forces involved in the solid wood rotating cutting process,” Journal of Materials Processing Tech 148(2), 220-225. DOI: 10.1016/S0924-0136(03)00880-X
Gharagheizi, F. (2007). “Qspr analysis for intrinsic viscosity of polymer solutions by means of ga-mlr and rbfnn,” Computational Materials Science 40(1), 159-167. DOI: 10.1016/j.commatsci.2006.11.010
Guillen, A., Pomares, H., Gonzalez, J., Rojas, I., Valenzuela, O., and Prieto, B. (2009). “Parallel multiobjective memetic rbfnns design and feature selection for function approximation problems,” Neurocomputing 72(16-18), 3541-3555.
Guo, X., Ekevad, M., Grönlund, A., Marklund, B., and Cao, P. (2014). “Tool wear and machined surface roughness during wood flour/polyethylene composite peripheral up-milling using cemented tungsten carbide tools,” BioResources 9(3), 3779-3791. DOI: 10.15376/biores.9.3.3779-3791
Guo, X., Li, R., Cao, P., Ekevad, M., Cristovao, L., Marklund, B., and Gronlund, A. (2015). “Effect of average chip thickness and cutting speed on cutting forces and surface roughness during peripheral up milling of wood flour/polyvinyl chloride composite,” Wood Research 60(1), 147-156.
Guo, X., Wang, J., Buck, D., Zhu, Z., Ekevad, M. (2021). “Cutting forces and cutting quality in the up-milling of solid wood using ceramic cutting tools,” The International Journal of Advanced Manufacturing Technology 114(5), 1575-1584. DOI: 10.1007/s00170-021-06991-x
Guo, X., Wang, J., Buck, D., Zhu, Z., and Guo, Y. (2021). “Machinability of wood fiber/polyethylene composite during orthogonal cutting,” Wood Science and Technology 55(2), 1-14. DOI: 10.1007/s00226-020-01256-4
Keturakis, G., and Bendikiene, R. (2016). “Influence of chemical composition of steels on the wood milling knives wear,” in: 18th International Conference – School Advanced Materials and Technologies 2016, Palanga, Lithuania, p. 139.
Li, W., F Pan, and Cao, W. (2013). “Study on feature selection and identification method of tool wear states based on svm,” International Journal on Smart Sensing and Intelligent Systems, 6(N°2), 448-465. DOI: 10.21307/ijssis-2017-549
Liu, C., He, Y., Wang, Y., Li, Y., and Wang, Y. (2020). “Effects of process parameters on cutting temperature in dry machining of ball screw,” ISA Transactions, 101. DOI: https://doi.org/10.1016/j.isatra.2020.01.031
Liu, S., Jin, S., Zhang, X., Chen, K., Wang, L., and Zhao, H. (2018). “Optimization of 3D surface roughness induced by milling operation for adhesive-sealing,” Procedia CIRP 71, 279-284. DOI: 10.1016/j.procir.2018.05.011
Luo, J. (2007). “NC milling cutter selection and cutting amount determination,” Mechanical Management and Development 2007(S1), 87-90. DOI: 10.16525/j.cnki.cn14-1134/th.2007.s1.043
MalkoҫoğLu, A. (2007). “Machining properties and surface roughness of various wood species planed in different conditions,” Building & Environment 42(7), 2562-2567. DOI: 10.1016/j.buildenv.2006.08.028
Ma, L., Li, C., Chen, J., Li, W., Tan, Y., Wang, C., and Zhou, Y. (2016). “Prediction model and simulation of cutting force in turning hard-brittle materials,” International Journal of Advanced Manufacturing Technology 91(1-4), 165-174. DOI: 10.1007/s00170-016-9642-9
Rudawska, A., Reszka, M., Warda, T., Miturska, I., Szabelski, J., Stančeková, D., and Skoczylas, A. (2016). “Milling as a method of surface pre-treatment of steel for adhesive bonding,” Journal of Adhesion Science and Technology 30(23), 1-18. DOI: 10.1080/01694243.2016.1191585
Sogutlu, C., Kaya, M., and Imirzi, H. O. (2017). “Effect of cutter types, spindle speed and feed rate on the surface quality in cnc milling,” in: The XXVIII International Conference Research for Furniture Industry, Poznan, Poland, 21-22 September 2017.
Sofuoğlu, M. A. (2019). “Prediction of stable depth of cuts in turning and milling operations: A new probabilistic approach,” Journal of the Brazilian Society of Mechanical Sciences and Engineering 41(5), article no. 206. DOI: 10.1007/s40430-019-1706-y
Sun, Y., J Xu, Qiang, H., Chen, and Lin, G. B. (2019). “Adaptive sliding mode control of maglev system based on rbf neural network minimum parameter learning method,” Measurement, 141. DOI: 10.1016/j.measurement.2019.03.006
Tiryaki, S., Malkoҫoğlu, A., and Ozsahin, S. (2014). “Using artificial neural networks for modeling surface roughness of wood in machining process,” Construction and Building Materials 66, 329-335. DOI: 10.1016/j.conbuildmat.2014.05.098
Tu, K., Wang, X., Kong, L., and Guan, H. (2018). “Facile preparation of mechanically durable, self-healing and multifunctional superhydrophobic surfaces on solid wood,” Materials and Design 140(FEB.), 30-36. DOI: 10.1016/j.matdes.2017.11.029
Umut, K. and Erhan, B. (2018). “Investigating effects of milling conditions on cutting temperatures through analytical and experimental methods,” Journal of Materials Processing Technology, 262, S0924013618303200-. DOI: 10.1016/j.jmatprotec.2018.07.024
Valarmathi, T. N., Palanikumar, K., and Sekar, S. (2015). “Modeling of surface roughness in drilling of MDF panels,” Applied Mechanics and Materials 766-767, 831-836. DOI: 10.4028/www.scientific.net/AMM.766-767.831
Vančo, M., Mazán, A., Barcík, S., Rajko, L., Koleda, P., Vyhnáliková, Z., and Safin, R. R. (2017). “Impact of selected technological, technical, and material factors on the quality of machined surface at face milling of thermally modified pine wood,” BioResources 12(3), 5140-5154. DOI: 10.15376/biores.12.3.5140-5154
Wang, D., and Chen, J. (2005). “Prediction of cutting force using BP artificial neural network,” Journal of Dalian University of Technology 45(6), 814-818.
Wang, S. Y., Xing, A. I., Zhao, J., Li, L. Z. and Liu, Z. W. (2006). “Milling force prediction model for high-speed end milling 3cr2mo steel,” Journal of Shandong University. DOI: 10.1016/S1003-6326(06)60027-7
Wang, L. Y., and Huang, H. H. (2010). “Milling force of plastic mold parts in high speed hard milling based on BP neural network,” Journal of Central South University (Science and Technology) 41(6), 2218-2223.
Yue, C., Huang, C., Liu, X., Hao, S., and Liu, J. (2017). “3D FEM simulation of milling force in corner machining process,” Chinese Journal of Mechanical Engineering 30(2), 286-293. DOI: 10.1007/s10033-017-0088-2
Zhang, L., Wang, F., Sun, T., and Xu, B. (2018). “A constrained optimization method based on BP neural network,” Neural Computing and Applications 29(2), 413-421. DOI: 10.1007/s00521-016-2455-9
Zhang, M., Liu, Y., and Yang, Z. (2015). “Correlation of near infrared spectroscopy measurements with the surface roughness of wood,” BioResources 10(4), 6953-6960. DOI: 10.15376/biores.10.4.6953-6960
Zhao, H., Feng, B., Dong, X., and Zhenhua, W. U. (2008). “Optimization choice of cutting parameter based on improved BP neural network,” Machine Tool & Hydraulics 36(5), 213-215.
Zheng, M. L., Jiang, B., Liu, J., and He, C. Y. (2008). “Research on dynamic cutting performance of high speed face milling cutter,” Key Engineering Materials 375-376, 663-666. DOI: 10.4028/www.scientific.net/KEM.375-376.663
Zhong, Z. W., Hiziroglu, S., and Chan, C. T. M. (2013). “Measurement of the surface roughness of wood based materials used in furniture manufacture,” Measurement 46(4), 1482-1487. DOI: 10.1016/j.measurement.2012.11.041
Zhu, Z., Buck, D., Guo, X., Ekevad, M., Cao, P., and Wu, Z. (2018). “Machinability investigation in turning of high density fiberboard,” PLoS ONE 13(9), article ID e0203838. DOI: 10.1371/journal.pone.0203838
Article submitted: November 24, 2021; Peer review completed: December 19, 2021; Revised version received and accepted: January 30, 2022; Published: February 4, 2022.
DOI: 10.15376/biores.17.2.2003-2019