
Abstract
Regression trees, random forests, and generalized additive models (GAM) are statistical techniques often used in several disciplines, but rarely in wood technology. This study presented a novel approach to predicting the modulus of elasticity of Uruguayan pine timber by applying three statistical techniques and using visual parameters and non-destructive testing. For this purpose, two sample groups of beams (50 mm × 150 mm × 2800 mm) were selected from two commercial plantations, one comprised of 122 specimens from 14-year-old loblolly pine (Pinus taeda) and the second comprised of 111 specimens from 27-year-old slash pine (P. elliottii). The visual parameters and dynamic modulus of elasticity for each specimen were obtained and associated with their experimental static bending stiffness. The number of annual rings per centimeter, twist, crook, and knot size were the most relevant visual variables for the modulus of elasticity prediction. The inclusion of the dynamic modulus of elasticity in the modeling improved the stiffness prediction by reducing the prediction error by 46% on average. The GAM had the best prediction, with a 10% prediction error, and explained 88% of the variability. These results suggested that GAM is a useful tool for stiffness prediction of Uruguayan pine timber.
Download PDF
Full Article
Prediction of the Bending Stiffness of Uruguayan Loblolly and Slash Pine Timber Applying Different Statistical Techniques
Andrea Cardoso,a Laura Moya,b,* and Alejandra Borges c
Regression trees, random forests, and generalized additive models (GAM) are statistical techniques often used in several disciplines, but rarely in wood technology. This study presented a novel approach to predicting the modulus of elasticity of Uruguayan pine timber by applying three statistical techniques and using visual parameters and non-destructive testing. For this purpose, two sample groups of beams (50 mm × 150 mm × 2800 mm) were selected from two commercial plantations, one comprised of 122 specimens from 14-year-old loblolly pine (Pinus taeda) and the second comprised of 111 specimens from 27-year-old slash pine (P. elliottii). The visual parameters and dynamic modulus of elasticity for each specimen were obtained and associated with their experimental static bending stiffness. The number of annual rings per centimeter, twist, crook, and knot size were the most relevant visual variables for the modulus of elasticity prediction. The inclusion of the dynamic modulus of elasticity in the modeling improved the stiffness prediction by reducing the prediction error by 46% on average. The GAM had the best prediction, with a 10% prediction error, and explained 88% of the variability. These results suggested that GAM is a useful tool for stiffness prediction of Uruguayan pine timber.
Keywords: Uruguayan Pinus taeda; Pinus elliottii; Visual grading; Bending stiffness; Generalized additive model
Contact information: a: Gerencia de I+D+i, LATU, Montevideo, Uruguay; b: Facultad de Arquitectura, Universidad ORT Uruguay, Montevideo, Uruguay; c: Facultad de Agronomía, Universidad de la República, Montevideo, Uruguay; *Corresponding author: moya@ort.edu.uy
INTRODUCTION
The physical and mechanical properties of timber are usually predicted by visual parameters. Pith presence and location (Dahlen et al. 2014), knot size (Guillaumet et al. 2007; Sotelo and Godina 2009; Vega et al. 2011), and growth ring width (Mascia and Cramer 2009; Baño et al. 2015; Fank et al. 2016), have been reported to be the main features that control the bending stiffness and strength of a piece of lumber. The number of annual rings per centimeter is an indicator of the growth rate of a tree, and it usually is associated with the juvenility or maturity of wood (e.g., fast growth rates produce high proportions of juvenile wood), which in turn is related to its mechanical properties. In line with this argument, it has been reported that juvenile wood in Uruguayan Pinus taeda and P. elliottii showed more detrimental influence on the stiffness than on the strength, with the former being the limiting property for class assignment according to the European strength class system (UNE-EN 384 2010) (Moya et al. 2015). The recent approval of the Uruguayan standard UNIT 1261 (UNIT 1261 2018) adopt the visual method for strength grading and provides the characteristics values of the main properties for two structural grades. However, there is a practical difficulty in distinguishing between the two grades that could be improved by the inclusion of the ring width measurement. Visual grading allocates timber into groups that presumably have similar properties, particularly, bending strength and stiffness. The modulus of elasticity of structural lumber can be determined by destructive and/or non-destructive tests (NDTs). Over the past few years, extensive research has been conducted to estimate lumber’s modulus of elasticity through various NDTs, including ultrasonic-based, ray-based, and dynamic (vibrations and stress wave) methods (Lei et al. 2005), the last of these being highly correlated with the bending modulus of elasticity, strength, and density (Acuña et al. 2001; O’Neill 2006; Iñiguez 2007). Among the NDTs, the longitudinal stress wave method has the potential to be an efficient tool for quality control all through the industrial chain. Several authors have reported that NDTs combined with visual grading have improved the modulus of elasticity prediction. (García et al. 2007; Casado et al. 2011).
Simple or multiple regressions are the most frequently used models in wood technology to predict the modulus of elasticity (Guillaumet et al. 2007; Hermoso et al. 2007; Vega et al. 2012). The statistical techniques regression trees (CART), random forests (RF), and generalized additive models (GAM) are powerful tools that have been widely applied in ecology (Yee and Mitchell 1991; Guisan et al. 2002; Austin 2007; Cutler et al. 2007; Meynard and Quinn 2007). The CART technique is used in ecology because of its ability for interpretation, high classification accuracy, and their potential to explain interactions between variables (Cutler et al. 2007). The fundamental idea of CART is to make a recursive binary partition of the independent variable values so that the values of the continuous response variable become increasingly homogeneous within the classes that form (Wilkinson 2004; Cutler et al. 2007). Such an approach can reveal the importance of the variable predictors and their interrelationships (James et al. 2013). As the name suggests, RF combines the predictions of several regression trees obtained from re-sampling on the database, randomly and with replacement, to ensure the same probability of choosing pieces each time. The RF technique does not have the instabilities of CART, but it has the disadvantage of not revealing the partition values of the predictor variables, as observed with CART (Breiman 2001). Besides, RF is robust for dealing with a database comprised of several explained variables and few observations (Cutler et al. 2011; Degenhardt et al. 2017). Generalized additive models are extended models from multiple linear regressions that make possible the prediction of a response variable value from several independent variables. Such an approach works with nonlinear responses of the dependent variables that improve the characterization of the phenomenon (Yee and Mitchell 1991; James et al. 2013). Compared with multiple regressions, the CART, RF, and GAM techniques have the advantage of not needing verification about normality or homoscedasticity, and they allow for the combination of categorical and numerical variables (James et al. 2013).
These statistical techniques have been employed for more than 30 years in several scientific fields. However, and probably due to unawareness of its potential or the habit of always employing the same techniques (e.g., multiple regressions), no literature reporting their use for timber grading is available. In this area, neural networks, a technique similar to CART and RF, called the attention of few researchers. A pioneering study on visual grading of P. nigra, compared the use of multiple regression techniques with neural networks and found that the latter improved the strength prediction precision by 15% (Mier et al. 2005). Recently, neural networks were used to predict the modulus of elasticity of Abies pinsapo timber through density, width, thickness, moisture content, NDT, and visual grading; an R2 value of 0.75 was reported (Esteban et al. 2009, 2017).
When comparing the CART and RF techniques with neural networks, the latter require a high number of observations to have a good prediction and a low number of independent variables to simplify the analysis. These facts were decisive for disregarding neural networks in the present study. On the other hand, CART, RF, and GAM make it possible to allocate timber in groups. Furthermore, using GAM it is possible to observe how the values of the visual parameters vary (qualitative and quantitative variables) to predict the modulus of elasticity.
The aim of this study was to predict the modulus of elasticity of Uruguayan loblolly and slash pine timber by applying the CART, RF, and GAM techniques and using visual parameters and NDTs as input variables.
EXPERIMENTAL
Materials
The experimental materials for this study came from two commercial loblolly and slash pine (Pinus elliottii and P. taeda) plantations. With similar silvicultural practices and typical densities of plantation of 1000 to 1100 trees per ha, these species having similar physical and mechanical properties are usually planted and commercialized indistinctly mixed (Moya et al. 2013). Climatic and soil conditions lead to fast growth rates, which in turn produce high percentages (5 to 10%) of juvenile wood (Moya et al. 2015).
Both plantations have sawmills and are located in the northeast of Uruguay. Sample 1, from Tacuarembó province (32°06′53″ S, 55°45′20″ W), was comprised of 14-year-old loblolly pine trees with pruning; and Sample 2, from Rivera province (30°54′09″ S, 55°33′02″ W), was comprised of 27-year-old slash pine trees with no pruning and no thinning. Approximately three hundred boards with dimensions of 60 mm- width, 150 mm-depth, and 3300 mm-length were randomly selected from each sawmill production line, kiln-dried to a 12% MC, and planed to the final dimensions (50 mm × 150 mm × 2800 mm). The cross section was selected based on being the most commonly used as structural component and due to limited availability in the industries. The beams were then wrapped with plastic film and transported to the Forest Products Department of the Laboratorio Tecnológico del Uruguay for further processing and analysis.
Methods
The study was performed in two phases: i) finding the most relevant variables to predict the modulus of elasticity from a small number of pieces that allows finding the largest number of explanatory variables without affecting the significance of the results; and, ii) proposing a model for stiffness prediction applying and validating the relevant variables determined in the first phase to a large number of pieces.
Phase 1
A total of 94 beams, 50 from Sample 1 and 44 from Sample 2, were evaluated. Typical visual parameters on each beam were measured according to UNE-EN 1310 (1997), and they were referred to as the largest knot on the face (KFACE), largest knot on the edge (KEDGE), bow (BOW), crook (CRK), and twist (TWI). Because knots have been reported to be one of the most important defects for reducing mechanical properties, further evaluation included additional variables, such as: i) the position of the largest knot in regards to the thirds of the specimen length (i.e., center or border, Fig. 1) for the face (PKFACE) and edge (PKEDGE); ii) largest area of the projection of all knots in a cross section divided by the cross sectional area (KAR1); iii) projection of the largest knot on the cross section in relation to the cross sectional area (KAR2); iv) projection of elongated knots on the cross section in relation to the cross sectional area (KAR3); and v) border area (BA), which was defined as one quarter of the face area located on the outer zones of the specimen face and expressed as a percentage of the cross sectional area.
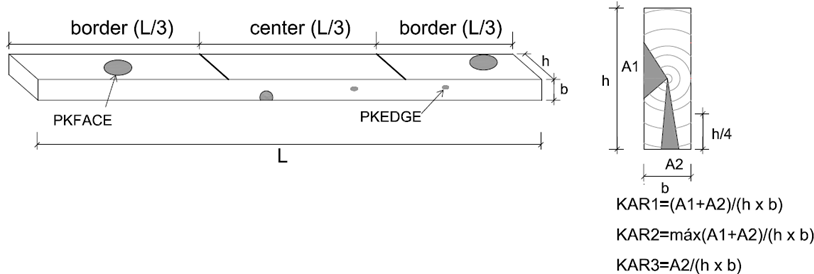
Fig. 1. Position and measurement of knots
The number of annual rings per centimeter (NARPC), and growth ring orientation (GRO) in regards to the sawing pattern (i.e., tangential in flat-sawn, radial in quarter-sawn, and semi in between flat- and quarter-sawn) were recorded. In addition, the presence of pith (PITH) was registered on the faces of each piece, as centered if it was contained in the central third of the piece width, or off center otherwise.
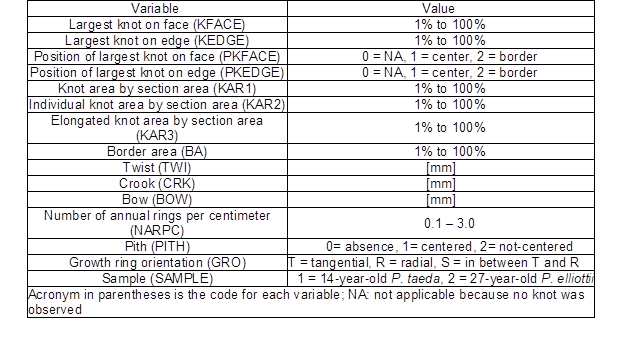
The above variables, including the Sample group (SAMPLE), were considered to be prediction variables and are listed in Table 1.
Table 1. Predicting Variables and Adopted Values
Phase 2
A total of 233 specimens, 122 from Sample 1 and 111 from Sample 2, which included those analyzed in Phase 1, were evaluated. In Phase 2, only the relevant variables determined in the previous phase were considered.
It should be mentioned that although in Phase 2 the sample size increased, the 94 specimens and the 15 initial variables evaluated in Phase 1 were sufficient to draw significant statistical data.
Property determination
In addition to the parameters listed in Table 1, the dynamic modulus of elasticity (Ed) of the beams was estimated by Non Destructive Techinques (NDT). The test was carried out using a Fakopp Microsecond Timer (Ágfalva, Hungary). The measurement instrument consisted of two piezoelectric-type transducers equipped with 60 mm long spikes. The spike probe fixes the transducer into the wood, one used for transmitting the signal and the other for receiving it. The stress wave was induced by a simple hammer impact, and then the stress wave transmission time was displayed on the timer in microseconds (Fig. 2). Three readings in longitudinal direction were performed and the average was recorded. The stress wave velocity (V) was obtained using Eq. 1,
V (m/s)=L/t x1000000 (1)
where L is the length of the beam (m) and t is the average transit time of the pulse from the transmitting transducer to the receiving transducer (us).
The dynamic modulus of elasticity (Ed) was then calculated with Eq. 2,
Ed (MPa) = ρ × V2 (2)
where ρ is the density (kg/m3) of the beams determined by the actual volume and weight at the time of testing.
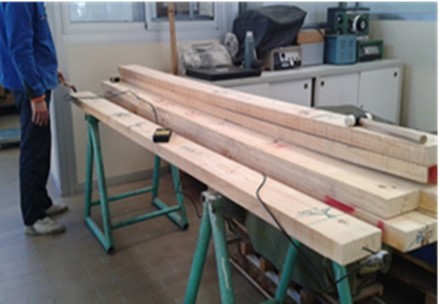
Fig. 2. Dynamic NDT set up
The beams were edgewise tested with four-point bending (Fig. 3) using a universal testing machine (Minebea 250 kN, Tokyo, Japan) to determine the global modulus of elasticity (E0) according to Eq. 3 (UNE-EN 408 2011),
![]()
where a is the distance between the nearest load point and point of support (mm); L is the bending span (mm); b and h are the width and height (mm), respectively; G is the shear modulus of elasticity, computed as E0/16 (UNE-EN 384 2010); F2 – F1 is the load increment on the straight line position of the load deformation regression curve between 20% and 30% of the maximum load (N); and w2 – w1 is the deformation increment corresponding to F2 – F1 (mm).
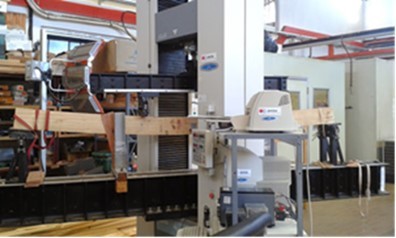
Fig. 3. Static four-point bending test set up
The ρ and MC of each specimen were determined according to Eqs. 4 and 5, respectively (UNE-EN 408 2011),
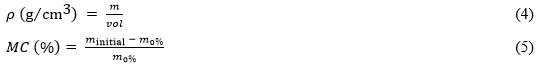
where m is the weight (g) and vol is the volume (cm3), both at the test MC; minitial is the weight of the specimen at the test time (g); and m0% is the oven-dry weight (g).
The E0 and ρ were adjusted to a 12% MC (UNE-EN 384 2010 and UNE EN 408 2011), and Ed by Eq. 6:
![]()
Statistical analysis
The Spearman correlation coefficient was first used to describe the association of each individual variable with the modulus of elasticity, and then the non-parametric Wilcoxon-Mann-Whitney test was applied to detect stiffness differences between groups comprised of grading variables. The CART, RF, and GAM techniques were applied using the R software (R.3.4.4, R Core Team Company, Vienna, Austria) (R Core Team 2018) to rank and select variables that would better predict the modulus of elasticity. For each technique, two different models were run, one with all of the variables listed in Table 1 and a second with all of the variables and Ed.
The models were compared using the percentages of explained variability (EV) and prediction error (PE). The former indicates the variability percentage among the observations explained by the model and the second shows the error of the stiffness prediction if additional specimens were included in the model. For this purpose, two-thirds of the data set was randomly sampled 50 times as a training sample to obtain prediction models, and the remaining one-third of the data was used to test the prediction ability of each model. For each prediction, the mean square prediction error was calculated as the square of the quadratic difference between the real and predicted stiffness values. The mean of these errors as a percentage of the mean stiffness (E0,mean) was defined as the PE.
RESULTS AND DISCUSSION
Influence of Each Individual Variable on the Modulus of Elasticity
Annual rings
A positive correlation between the E0 and NARPC was observed (correlation coefficient, r = 0.56; p < 0.05). The r was higher compared with those of the other visual variables (data not shown). It is widely accepted that fast growing trees produce high proportions of juvenile wood with large cell cavities, thin cell walls, low densities, and high fiber angles, which in turn, decrease the mechanical properties (Green et al. 1999). In coniferous species, each individual annual ring represents one growth year (Miller 1999), and thus a large NARPC reduces the proportion of juvenile wood to mature wood, which improves the mechanical properties. In line with the findings of this study, Haselein et al. (2000) studied 30-year-old Brazilian P. elliottii and reported an R2 of 0.78, using an adjusted linear multiple regression model to estimate the E0 considering the percentage of mature wood and number of annual rings per inch. Mascia and Cramer (2009) reported an association between the E0 and number of annual rings per inch, based on the R2 of a quadratic regression model (0.48). Conversely, Fernández-Golfín and Diéz (1994) evaluated the relationship between the E0 and width of annual rings on 25-year-old trees from three Spanish coniferous species and obtained R2 values of 0.07 for P. pinaster and P. sylvestris, and a R2 of 0.14 for P. radiata. In a subsequent study on P. radiata and P. pinaster, Fenández-Golfín et al. (1997) reported an R2 of 0.35 between the E0 and annual ring width, and it was concluded from both studies that it was not possible to predict the modulus of elasticity from the annual ring width. Knots
In Phase 1, no association between the E0 and variables related to the knot area, i.e., KAR1, KAR2, KAR3, and BA, was found (p > 0.05). These results contradicted those of Sotelo and Godina (2009), who reported an association between the E0 and projected knot area, based on an R2 of 0.39 from a simple regression model. Additionally, Gaunt (2004) in a study on Douglas fir (Pseudotsuga menziesii) and radiata pine (Pinus radiata), obtained a negative association between stiffness and projected knot area, with an r value of -0.39.
The stiffness was not associated (p > 0.05) with either the PKFACE or PKEDGE. Variables related to the knot diameter had a significant correlation with the E0. In Phase 2, the estimated r for the KFACE and E0 was -0.23 (p < 0.05), which was similar to that obtained in Phase 1. The mechanical properties decreased because the knot size was attributed to the deviation of wood fiber around the knot (Green et al. 1999; Kretschmann and Green 1999; Guillaumet et al. 2008; Fank et al. 2016). In pine timber, fiber around the knot frequently formed nearly 90° angles with respect to the longitudinal axis of the piece. In this analysis, no correlation between the KEDGE and E0 (p = 0.15) was detected. Vega et al. (2011) studied Castanea sativa Mill. and observed r values of -0.24 and -0.18 between the E0 and the KFACE and KEDGE, respectively. Pith
The E0,mean of the Sample 1 specimens (5558 MPa) was significantly lower (p < 0.05) than for the Sample 2 specimens (6872 MPa), which was explained by the presence of juvenile wood that usually forms between 5 years or 10 years to 20 years in coniferous trees (Kretschmann and Bendtsen 1992; Green et al. 1999; Tuset and Durán 2008). In this study, the presence of pith was an indicator of juvenile wood, where 104 specimens from Sample 1 and 56 from Sample 2 contained pith. In both phases, significant differences between the stiffness of the beams with and without pith were observed (p < 0.05), yet the pith position within the beam face did not have a significant effect (p > 0.05). The specimens with pith showed 21% lower E0,mean values than those without pith. This result was consistent with those of Dahlen et al. (2014) and Fank et al. (2016), who found differences of 35% and 43%, respectively, for the E0,mean in boards with pith versus those without pith.
Warp
In both phases, the stiffness was significantly correlated with the TWI and CRK, with r values of -0.41 (p < 0.05) and -0.20 (p < 0.05), respectively. No correlation between the E0 and BOW (p = 0.10) was detected. It is worth noting that these deformations were included in the analysis for standardization purposes (i.e., to segregate strength classes). Warp is generally related to the transformation processes (particularly with drying) in the industry, and not with the mechanical properties of wood. The first findings relating TWI and CRK with E0, hinders to discriminate the effect of the intrinsic variables of the wood on the mechanical properties, and the effect of the variables generated by the transformation process. Dynamic modulus of elasticity
In both phases, an r value of 0.92 (p < 0.05) between the bending stiffness and Ed was observed (Fig. 4). Similarly, Acuña et al. (2001) reported an R2 of 0.71 for a linear multiple regression model that estimated the E0 by considering the Ed and density of Spanish P. sylvestris. Iñiguez (2007) reported an R2 of 0.83 for a linear regression between the E0 and Ed for Spanish P. nigra.
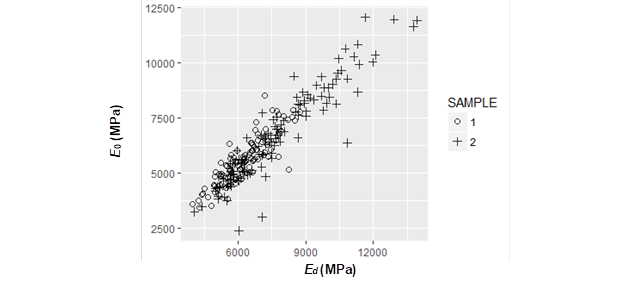
Fig. 4. Scatterplot relating the E0 and Ed
The KFACE, TWI, CRK, PITH, NARPC, SAMPLE, GRO, and Ed were the variables that significantly correlated with the E0. The KEDGE did not significantly correlate with the E0, but was included in the following multivariate analysis because most authors in the literature reported a strong association between the KEDGE and E0 (Vega et al. 2011; Baño et al. 2015).
Multivariate Analysis for the Modulus of Elasticity Prediction
Six models were obtained using the CART, RF, and GAM techniques. Table 2 summarizes the relevant variables for the E0 predictions from the CART, RF, and GAM techniques.
Table 2. Models, Relevant Variables, and Results for the Modulus of Elasticity Prediction Obtained by the CART, RF, and GAM Techniques
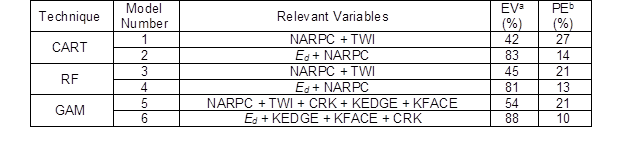
When Ed was not included in the model (models 1, 3, and 5), the NARPC and TWI were found to be relevant variables for the E0 prediction for each of the three techniques, which was explained by the association of these two variables with the presence of juvenile wood and the reduced effect on the stiffness. A low NARPC usually indicates fast growing rates in a tree. That is the case of Uruguayan fast growing plantations, in which trees are frequently harvested before attaining maturity, showing high proportions of juvenile wood and leading to subsequent warping of lumber (Baño et al. 2015; Moya et al. 2015). In addition to the NARPC and TWI, the GAM found that the CRK, KEDGE, and KFACE were relevant variables for the E0 prediction. It is worth noting that the influence of the KEDGE on the E0 was detected by the GAM possibly because it existed in narrow ranges (e.g., between 70% and 100% for KEDGE), while no association between the E0 and whole KEDGE range for the correlation analysis was observed.
Among the models that excluded Ed, the GAM model (model 5) presented the highest EV of the E0 (54%) and lowest PE (21%). Similar results were found by Hermoso et al. (2007), who reported an R2 of 41.5% to explain the variability in the bending stiffness from the density and knots of Spanish radiata pine.
In addition to the differences in the significant variables observed in each model (Table 2), the inclusion of the Ed as a predicting variable improved the PE by 48%, 38%, and 52% in the CART, RF, and GAM, respectively. Moreover, the percentages of EV of the models that included the Ed (model 2, 4, and 6) were higher than those from the models without the Ed (model 1, 3, and 5). Similar conclusions regarding the combination of visual parameters with NDTs for the stiffness prediction were reported by several authors (Ceccotti and Togni 1996; García et al. 2007; Casado et al. 2011).
The Ed was the most relevant variable detected by the three techniques, as shown by previous results. The NARPC was found to be relevant by the CART and RF, but not by the GAM, when the Ed was included as an explanatory variable. The NARPC was co-linear with the Ed (r = 0.52; p < 0.05) and therefore, was not detected as a relevant variable by the GAM, a technique that has been reported to be sensitive to the co-linearity of prediction variables (Yee and Mitchell 1991). The GAM modeling resulted in the largest number of significant variables (p < 0.05). Furthermore, model 6 showed the highest percentage of EV and lowest PE (Table 2). The EV and PE found for model 6 suggested that this model is more accurate for stiffness prediction compared with those that included NDT-employed regression techniques (García et al. 2007; Casado et al. 2011) or applied neural network modeling (Mier et al. 2005). Therefore, GAM modeling provides a useful tool to improve the prediction of Uruguayan pine timber stiffness, when using visual parameters and the Ed as input variables.
CONCLUSIONS
A novel approach involving three statistical techniques (CART, RF, and GAM) was employed to select and rank the most relevant explanatory variables for stiffness prediction of Uruguayan loblolly and slash pine timber.
The NARPC, CRK, KFACE, and KEDGE were found to be the significant visual variables associated with the static bending stiffness, being the later significantly correlated to the dynamic modulus of elasticity. Besides, in spite of finding significant correlation between TWIST and E0, the former is usually related to the drying process, and not to the mechanical properties of wood.
The sample source, pith, and annual ring orientation were individually associated with the bending stiffness, but they were not relevant in the multivariate analysis. Furthermore, inclusion of the dynamic modulus of elasticity in the modeling improved the stiffness prediction by reducing the prediction error by 46% on average.
With the exception of the dynamic modulus of elasticity, none of the visual variables individually explained the behavior of the longitudinal modulus of elasticity. On the other hand, results of the models 1, 3 and 5 that included a series of relevant visual variables indicated that it is possible to predict the longitudinal modulus of elasticity with an acceptable prediction error of 23% on average.
The GAM with visual parameters and the dynamic modulus of elasticity as input variables was found to be the best model to predict the bending stiffness.
ACKNOWLEDGEMENTS
This study was developed in the frame of a timber strength project on Pinus sp. conducted by the Laboratorio Tecnológico del Uruguay (LATU). The authors gratefully acknowledge the Dirección Nacional de Industria (DNI) (Grant 1318/011) for providing funds.
REFERENCES CITED
Acuña, L., Llorente, A., Herrera, C., and Casado, M. (2001). “Clasificación de la madera de Pinus sylvestris L. mediante ensayos no destructivos,” in: Proceedings of Spanish Forestry 2001 Congress, Granada, Spain.
Austin, M. (2007). “Species distribution models and ecological theory: A critical assessment and some possible new approaches,” Ecol. Model. 200(1-2), 1-19. DOI: 10.1016/j.ecolmodel.2006.07.005
Baño, V., Moya, L. M., O’Neill, H., Cardoso, A., Cagno, M., Cetrangolo, G., and Domenech, L. (2015). Documentos Técnicos Base para la Normalización de Estructuras y Construcción con Madera (Fondo Industrial PR No. 3823/013), Facultad de Ingeniería, Montevideo, Uruguay.
Breiman, L. (2001). “Random forest,” Mach. Learn. 45(1), 5-32. DOI: 10.1023/A:1010933404324.
Casado, M., Acuña, L., Vecilla, D., Basterra, L. A., Relea, E., and López, G. (2011). “Ultrasonidos y parámetros de clasificación visual para la caracterización de madera estructural de Populus x euramericana I-214,” in: Proceedings of CIMAD 11, Coímbra, Portugal.
Ceccotti, A., and Togni, M. (1996). “NDT on large ancient timber beams: Assessment of strength/stiffness properties combining visual and instrumental methods,” in: Proceedings of the 10th International Symposium on Nondestructive Testing of Wood, Lausanne, Switzerland.
Cutler, D. R., Edwards Jr., T. C., Beard, K. H., Cutler, A., Hess, K. T., Gibson, J., and Lawler, J. J. (2007). “Random forests for classification in ecology,” Ecology 88(11), 2783-2792. DOI: 10.1890/07-0539.1
Dahlen, J., Jones, P. D., Seale, R. D., and Shmulsky, R. (2014). “Sorting lumber by pith and its effect on stiffness and strength in southern pine No. 2 2×4 lumber,” Wood Fiber Sci. 46(2), 186-194.
Degenhardt, F., Seifert, S. and Szymczak, S. (2017). “Evaluation of variable selection methods for random forests and omics data sets,” Briefings in Bioinformatics. 1-12. DOI: 10.1093/bib/bbx124.
Dieste, A. (2012). “Programa de promoción de exportaciones de productos de madera,” (http://gp.gub.uy/sites/default/files/documentos/programa_de_promocion_de_exportaciones_de_productos_de_madera_-_informe_preliminar_andres_dieste_-_2012.pdf), Accessed on 3rd Aug 2014.
Esteban, L. G., Fernández, F. G., and de Palacios, P. (2009). “MOE prediction in Abies pinsapo Boiss. timber: Application of an artificial neural network using non-destructive testing,” Comput. Struct. 87(21-22), 1360-1365. DOI: 10.1016/j.compstruc.2009.08.010
Esteban, L. G., de Palacios, P., Conde, M., Fernández, F. G., García-Iruela, A., and González-Alonso, M. (2017). “Application of artificial neural networks as a predictive method to differentiate the wood of Pinus sylvestris L. and Pinus nigra Arn subsp. salzmannii (Dunal) Franco,” Wood Sci. Technol. 51(5), 1249-1258. DOI: 10.1007/s00226-017-0932-7
Fank, P. Y., Stefani, P. M., and Piter, J. C. (2016). “Análisis de la relación entre las propiedades mecánicas de flexión y tracción paralela a las fibras en la madera de pino resinoso cultivado en el nordeste de Argentina,” in: Proceedings of the 15th EBRAMEM, Curitiba, Brasil.
Fernández-Golfín, J. I., and Diez, M. R. (1994). “Influencia de la anchura del anillo de crecimiento en la densidad y otras propiedades físico-mecánicas de la madera estructural de diversas especies,” Investigaciones Agrarias. Sistemas y Recursos Forestales 3(2), 211-219.
Fernández-Golfín, J. I., Diez, M. R., and Gutiérrez A. (1997). “Caracterización mecánica de la madera aserrada de pino silvestre de los sistemas Central e Ibérico mediante probetas de tamaño estructural,” Investigaciones Agrarias. Sistemas y Recursos Forestales 6(1-2), 183-215.
Ferrari, R. P. (2016). Forestación en Uruguay: Una Apuesta al Porvenir, Plus-Ultra Ediciones, Montevideo, Uruguay.
García, M. C., Fernández-Golfín, J. I., and Hermoso, E. (2007). “Mejora de la predicción de la resistencia y rigidez de la madera estructural con el método de ultrasonidos combinado con parámetros de clasificación visual,” Mater. Construc. 57(288), 49-59. DOI: 10.3989/mc.2007.v57.i288.64
Gaunt, D. (2004). “Upcoming changes to structural timber,” New Zealand Timber Design Journal 1(13), 19-25.
Green, D. W., Winandy, J. E., and Kretschmann, D. E. (1999). “Mechanical properties of wood,” in: Wood Handbook: Wood as an Engineering Material (FPL-GTR-113), U.S. Department of Agriculture Forest Products Laboratory, Madison, WI.
Guillaumet, A. A., Manavella, R. D., Filippetti, M. C., and Diab, J. (2007). “Clasificación visual resistente de la Araucaria angustifolia procedente de El Dorado, Misiones Argentina,” in: Proceedings of the 3rd Forestry and Non-forestry Products Ibero-American Congress, Buenos Aires, Argentina.
Guillaumet, A. A., Manavella, R. D., Filippetti, M. C., Diab, J., and Armas, A. (2008). “Relación entre la nudosidad y las características resistentes de la Araucaria angustifolia (Pino Paraná),” in: Proceedings of the 20th Jornadas Argentinas de Ingeniería estructural, Buenos Aires, Argentina.
Guisan, A., Edwards Jr., T. C., and Hastie, T. (2002). “Generalized linear and generalized additive models in studies of species distributions: Setting the scene,” Ecol. Model. 157(2-3), 89-100. DOI: 10.1016/S0304-3800(02)00204-1
Haselein, C. R., Cechin, E., Santini, E., and Gatto, D. A. (2000). “Características estruturais da madeira de Pinus elliottii Engelm aos 30 anos de idade,” Cienc. Florest. 10(2), 135-144. DOI: 10.5902/19805098487
Hermoso, E., Carballo, J., and Fernández-Golfín, J. I. (2007). “Caracterización estructural de la madera de Pinus radiata D. Don del país vasco (España) acorde a las modificaciones normativas,” Maderas-Cienc. Tecnol. 9(3), 223-232. DOI: 10.4067/S0718-221X2007000300003
Iñiguez, G. G. (2007). Clasificación Mediante Técnicas no Destructivas y Evaluación de las Propiedades Mecánicas de la Madera Aserrada de Coníferas de Gran Escuadría para uso Estructural, Ph.D. Thesis, Universidad Politécnica de Madrid, Madrid, España.
James, G., Witten, D., Hastie, T., and Tibshirani, R. (2013). An Introduction to Statistical Learning: With Application in R, Springer Science+Business Media, New York, NY.
Kretschmann, D. E., and Bendtsen B. A. (1992). “Ultimate tensile stress and modulus of elasticity of fast-grown plantation loblolly pine lumber,” Wood Fiber Sci. 24(2), 189-203.
Kretschmann, D. E., and Green, D. W. (1999). “Lumber stress grades and design properties,” in: Wood Handbook: Wood as an Engineering Material, U.S. Department of Agriculture Forest Products Laboratory, Madison, WI.
Lei, Y. C., Zhang, S. Y., and Jiang, Z. (2007). “Models for predicting lumber bending MOR and MOE based on tree and stand characteristics in black spruce,” Wood Sci. Technol. (39), 37-49. DOI: 10.1007/s00226-004-0269-x.
Mascia, N. T., and Cramer, S. M. (2009). “On the effect of the number of annual growth rings, specific gravity and temperature on redwood elastic modulus,” Maderas-Cienc. Tecnol. 11(1), 47-60. DOI: 10.4067/S0718-221X2009000100004
Meynard, C. N., and Quinn, J. F. (2007). “Predicting species distributions: A critical comparison of the most common statistical models using artificial species,” J. Biogeogr. 34(8), 1455-1469. DOI: 10.1111/j.1365-2699.2007.01720.x
Mier, R., García de Seca, J. L., Diez, M. R., Fernández-Golfín, J. I., and Hermoso Prieto, E. (2005). “Aplicación de redes neuronales a la clasificación de madera estructural. Comparación con otros métodos de clasificación,” in: Proceedings of the 4th Spanish Forestry Congress Actas, Zaragoza, Spain.
Miller, R. B. (1999). “Structure of wood,” in: Wood Handbook: Wood as an Engineering Material, U.S. Department of Agriculture Forest Products Laboratory, Madison, WI.
Ministerio de Ganadería Agricultura y Pesca (MGAP) (2012). “Actualización de la cartografía forestal de Uruguay,” (http://www.mgap.gub.uy/sites/default/files/multimedia/areacartografia2012.pdf), Accessed 20 Sep 2016.
Moya, L., Cardoso, A., Cagno, M., and O’Neill, H. (2015). “Caracterización estructural de madera aserrada de pinos cultivados en Uruguay,” Maderas-Cienc. Tecnol. 17(3), 597-612. DOI: 10.4067/S0718-221X2015005000053
Moya, L., Laguarda, M. F., Cagno, M., Cardoso, A., Gatto, F., and O’Neill, H. (2013). “Physical and mechanical properties of loblolly and slash pine wood from Uruguayan plantations,” Forest Prod. J. 63(3-4), 128-137. DOI: 10.13073/FPJ-D-13-00024
O’Neill, H. (2006). Estimación de la Calidad de la Madera Producida en el Uruguay para uso Estructural y su Evaluación en Servicio por Métodos No Destructivos (Report No. 4), Laboratorio Tecnológico del Uruguay, Montevideo, Uruguay.
R Core Team (2018). R: A Language and Environment for Statistical Computing, R Foundation for Statistical Computing, Vienna, Austria.
Sotelo, R. D., and Godina, R. L. (2009). “Efecto de los nudos sobre la resistencia y rigidez en flexión de la madera de pino,” Ciencia Forestal en México 34(106), 205-212.
Tuset, R., and Durán, F. (2008). Manual de Maderas Comerciales, Equipos y Procesos de Utilización 2nd Edition, Hemisferio Sur, Montevideo, Uruguay.
UNE-EN 1310 (1997). “Madera aserrada y madera en rollo. Método de medida de las singularidades,” Asociación Española de Normalización y Certificación, Madrid, España.
UNE-EN 384 (2010). “Madera estructural. Determinación de los valores característicos de las propiedades mecánicas y la densidad,” Asociación Española de Normalización y Certificación, Madrid, España.
UNE-EN 408 (2011). “Estructuras de madera. Madera aserrada y madera laminada encolada para uso estructural. Determinación de algunas propiedades físicas y mecánicas,” Asociación Española de Normalización y Certificación, Madrid, España.
UNIT 1261 (2018). “Madera aserrada de uso estructural. Clasificación visual, Madera de pino taeda y pino ellioti (Pinus taeda y Pinus elliottii),” Instituto Uruguayo de Normas Técnicas, Montevideo, Uruguay.
Vega, A., Dieste, A., Guaita, M., Majada, J., and Baño, V. (2012). “Modelling of the mechanical properties of Castanea sativa Mill. structural timber by combination of non-destructive variables and visual grading parameters,” Eur. J. Wood Wood Prod. 70(6), 839-844. DOI: 10.1007/S00107-012-0626-7
Vega, A., Guaita, M., Dieste, A., Majada, J., Fernández, I., and Baño, V. (2011). “Evaluation of the influence of visual parameters on wave transmission velocity in sawn chestnut timber,” in: Proceedings of the 17th International Wood Non-destructive Testing Symposium, Sopron, Hungary.
Wilkinson, L. (2004). “Classification and regression trees,” in: Systat 11, SYSTAT Software, Inc., Richmond, CA, pp. 35-56.
Yee, T. W., and Mitchell, N. D. (1991). “Generalized additive models in plant ecology,” J. Veg. Sci. 2(5), 587-602. DOI: 10.2307/3236170
Article submitted: August 10, 2018; Peer review completed: October 11, 2018; Revised version received and accepted: November 28, 2018; Published: December 5, 2018.
DOI: 10.15376/biores.14.1.755-768