
Abstract
The bending stiffness of pulp fibers in both dry and wet states is of great importance with respect to many optical and physical paper properties. We introduce a method that evaluates fiber bending stiffness from the fibers’ Young’s modulus (E) and the area moment of inertia (I) from the fiber cross section. The values for E and I in the dry state are obtained from single fiber tensile testing and image analysis of the fiber cross section. The values for the wet state are estimated from literature results for decreasing elastic modulus due to wetting and by the measurement of swollen, freeze-dried fiber cross sections by serial sectioning. We show a comparison between the results from our method and the bending stiffness of individual fibers measured with other methods.
Download PDF
Full Article
Pulp Fiber Bending Stiffness in Wet and Dry State Measured from Moment of Inertia and Modulus of Elasticity
Christian Lorbach,a Wolfgang J. Fischer,a,b Adriana Gregorova,cUlrich Hirn,a,b,* and Wolfgang Bauer a
The bending stiffness of pulp fibers in both dry and wet states is of great importance with respect to many optical and physical paper properties. We introduce a method that evaluates fiber bending stiffness from the fibers’ Young’s modulus (E) and the area moment of inertia (I) from the fiber cross section. The values for E and I in the dry state are obtained from single fiber tensile testing and image analysis of the fiber cross section. The values for the wet state are estimated from literature results for decreasing elastic modulus due to wetting and by the measurement of swollen, freeze-dried fiber cross sections by serial sectioning. We show a comparison between the results from our method and the bending stiffness of individual fibers measured with other methods.
Keywords: Microtomy; Serial sectioning; Single fiber testing; Mechanical properties; Cross sectional properties; E-modulus; Bending stiffness; Fiber flexibility
Contact information: a: Institute of Paper, Pulp and Fiber Technology, Graz University of Technology, NAWI Graz, Inffeldgasse 23, 8010 Graz, Austria; b: CD-Laboratory for Surface Chemical and Physical Fundamentals of Paper Strength, Graz University of Technology, Petersgasse 16, 8010 Graz, Austria;
c: Institute for Chemistry and Technology of Materials, Graz University of Technology, Stremayrgasse 9, 8010 Graz, Austria; *Corresponding author: ulrich.hirn@tugraz.at
INTRODUCTION
The bending stiffness of pulp fibers is of great importance for many optical and physical properties of paper (Clark 1985). Paper properties such as tensile strength, sheet porosity, light scattering coefficient, and surface smoothness are affected considerably (Paavilainen 1993). During papermaking, the fibers’ bending stiffness influences the consolidation of the web, the drainage (Helle 1978), and the wet web strength (Robertson et al. 1961). Wet fiber flexibility also controls the number of joints formed in the sheet (Clark 1985; Torgnysdotter and Wågberg 2004).
In this paper, we propose an alternative method to determine fiber bending stiffness. Knowing the fiber’s elastic modulus (E) and the area moment of inertia (I) of the fiber cross section, it is possible to estimate the fiber’s bending stiffness (E ∙ I) according to fundamental mechanics, i.e., beam theory. The proposed method can be applied for dry and wet fibers. It is well known that pulp fibers change their size according to their moisture content by swelling and shrinking (Forseth and Helle 1997), leading to changes in the fiber cross section and area moment of inertia as well as changes in the elastic modulus. Thus, to calculate wet fibers’ bending stiffness, changes in cross sectional size and shape as well as in elastic modulus due to swelling have to be taken into consideration.
The main benefit of the proposed method is that it provides an alternative means to determine wet and dry bending stiffness, which normally has to be measured by tedious single fiber testing methods such as flow cell techniques.
In this paper, we first give an overview of fiber bending stiffness testing. Then, we describe the determination of fiber cross section area moment of inertia and elastic modulus for individual fibers. Finally, we present results for individual fiber bending stiffness values, and we compare these results to measured values reported in the literature.
Definition of bending stiffness and flexibility
The bending stiffness according to standard mechanics is defined as the product of the fiber’s E-modulus and the area moment of inertia of the fiber’s cross section (Samuelsson 1963). Also, according to beam theory, fiber flexibility is the reciprocal of the fiber’s bending stiffness (Yan et al. 2008).
Bending stiffness = E ∙ I Samuelsson (1963) (1)
Flexibility = 1 / E ∙ I Yan et al. (2008) (2)
E-modulus and cross sectional area
The E-modulus of pulp fibers exhibits large variability. Fiber geometrical properties like cell wall thickness, fiber width, and fiber thickness affect the fiber’s E-modulus and show great variation within a pulp fiber population. The major reason for this is the difference between earlywood and latewood fibers. Another reason for variation of the E-modulus is differences in the fibril angle of the secondary fiber wall (Page et al. 1977). The fibers’ E-moduli decrease with increasing fibril angle. Page et al. (1977) used spruce fibers for their trials where they detected E-moduli in a range from 20 to 80 GPa. Groom et al. (2002) determined the average E-modulus of loblolly pine latewood fibers to be 19.7 GPa, with a range from 6.55 to 27.5 GPa. They also analyzed the fiber cross section area using CLSM. The mean cross section area was 350 µm². Mott et al. (2002) analyzed loblolly pine earlywood fibers measuring a mean E-modulus of 14.8 GPa and a mean fiber cross section area of 244 µm². For viscose fibers with a diameter of 10.4 µm, Adusumalli et al. (2006) applied tensile testing to determine the E-modulus. Their mean result was 12 GPa.
In 1959, Jayne studied different fibers regarding their mechanical properties. He measured a mean earlywood E-modulus of 25.2 GPa for fibers of white spruce, cypress, and Douglas-fir, and a mean value of 35.1 GPa for the corresponding latewood fibers. Furthermore, he determined the fiber’s cross sections using a light microscope and found results ranging from 205.16 µm² (earlywood) to 456.77 µm² (latewood).
Ehrnrooth and Kolseth (1984) applied tensile testing on Norway spruce fibers with different degrees of residual lignin. In addition, they measured the cross sectional area of dry fibers. Dry Norway spruce fibers with a lignin content of 26.3% had an E-modulus of 26.7 GPa, whereas the wet fibers had a modulus of 9.2 GPa. The dry fiber cross section area was 340 µm². The fiber population with 9.9% of residual lignin had a dry E-modulus of 20.8 GPa, a wet E-modulus of 4.3 GPa, and a dry cross section area of 319 µm².
Kallmes and Perez (1966) analyzed an unbleached kraft pulp mixture of western Canadian spruce and pine at a ratio of 50/50. The 239 unbeaten and dry fibers tested gave a mean E-modulus of 17.3 GPa.
Kersavage (1973) tested the tensile properties of individual delignified Douglas-fir summerwood tracheids under controlled relative humidity conditions. Tension was tested axially at moisture contents of 0, 6, 12, and 18% and in a water-soaked condition (giving a moisture content of 30%). Wood samples were delignified to a residual lignin content of 2 to 3%. Only fibers with a length greater than 2.5 mm were chosen for testing using a stereoscopic microscope with a magnification of 40x. The tensile testing system employed a gripping method for self-alignment of the test specimen. Fibers were not gripped directly but by epoxy droplets, similar to the method of Schniewind (1966). Kersavage measured the maximum tensile strength and E-modulus at about 6% to 12% moisture content.
Area moment of inertia
The area moment of inertia of the fiber’s cross section is influenced by the shape and size of the cross section and is always defined with respect to the bending axis. Figure 1 displays two cross sections of beams or fibers. The fiber axis is perpendicular to the image plane. Depending on which direction the fiber (the beam) is bent, a different moment of inertia has to be applied. If the beam is bent horizontally, the area moment of inertia Iz around the z-axis must be applied. If the beam is bent vertically, the relevant area moment of inertia is Iy, i.e., the moment around the y-axis. The area moment of inertia is defined as
 (3)
(3)
The quantity I integrates the area dA times the distance to the relevant axis squared. It is apparent from Fig. 1 and the corresponding formulas that the cross section’s size has a great influence on the moment of inertia.

Fig. 1. Definition of I. The size of the cross section strongly affects I.
The shape of the cross section also has a strong influence (Fig. 2). Figure 2 shows two ellipses with equivalent cross sectional areas, but different shape. The area moment of inertia for these two cross sections is given in Eq. 4 (Schnell et al. 1995).
 (4)
(4)
One can see that the right ellipse, which is more anisotropic, has extensively different moments of inertia Iy2 and Iz2. This is not so much the case for the left ellipse. The more anisotropic the cross section of a beam is, the higher becomes its bending stiffness in the direction of its largest elongation; accordingly, the bending stiffness drops perpendicular to this direction.

Fig. 2. Influence of shape on I
This is highly relevant for the bending stiffness of fibers. Consider two identical fibers that are only rotated by 90° (Fig. 3). Assuming horizontal bending, the relevant area moment of inertia is around the y-axis for the left fiber (Iy) and around the z-axis for the right fiber (Iz). Clearly, the bending stiffness (for horizontal bending) is much higher for the right fiber than for the left. This is an effect of the bending direction; when applying vertical bending, the left fiber has a much higher bending stiffness due to the higher moment of inertia Iz.

Fig. 3. Influence of load direction on I of a pulp fiber; left fiber: Iy, right fiber: Iz, Iy < Iz
Influence of hemicellulose on single fiber tensile properties
The hemicellulose content of fibers is considered to be the most important factor influencing the tensile properties of individual fibers (Kersavage 1973; Spiegelberg 1966). Sedlachek (1995) stated that hemicellulose has an amorphous structure and is hydrophilic. Hemicellulose is capable of taking up large amounts of water, whereas the crystalline regions of cellulose cannot be accessed by water (Clark 1969). Removing hemicellulose from pulp fibers makes them more crystalline (Spiegelberg 1966), which leads to more brittle fibers due to drying. A brittle fiber is more sensitive to the formation of defects compared to a wet fiber. This means that pure cellulosic, crystalline, dry fibers have a higher wet strength than dry strength (Kersavage 1973). One example of this is cotton fibers (Das et al.2009).
In wood pulp fibers at increasing water content, hemicellulose becomes ductile and weaker. The higher the water content is, the more internal bonds between cellulose and hemicellulose are broken, leading to a decrease in overall fiber strength (Kersavage 1973).
The reduction of the E-modulus in the wet state can be explained by the fact that the cohesiveness of the cell wall or bonding between cellulosic materials is reduced. Furthermore, water on intramolecular surfaces leads to slippage of microfibrils (Kersavage 1973; Sedlachek 1995).
Determination of the Dry and Wet Bending Stiffness
The most common way to measure single fiber bending stiffness is by using a flow cell and examining the wet fiber flexibility, which is the inverse of the wet bending stiffness. There are few examples of direct measurement of single fiber dry bending stiffness in the literature.
Dry bending stiffness measurements
Schniewind’s method is based on Seborg’s and Simmonds’ approach (Schniewind et al. 1966; Seborg and Simmonds 1941), which is suitable for dry and wet fibers. They used the fiber as a cantilever beam and applied force at the free end through a quartz helix spring. The spring extension, the span, and the deflection of the fiber were measured microscopically to determine the load. Schniewind et al.analyzed unbleached and unbeaten white fir fibers. The fibers were measured in both dry and wet states, with a distinction between earlywood and latewood. For the unbeaten and dry earlywood fibers, they measured a bending stiffness of 3.129 ∙ 10 -5 Nmm². For the unbeaten and dry latewood fibers, they showed an average bending stiffness of 1.543 ∙ 10 -4 Nmm².
Duncker et al. (1966) analyzed unbleached sulfite and sulfate spruce pulp fibers (Picea excelsa). The fibers were agitated in silicone fluid, which was used as the medium according to the method of Samuelsson (1963). The force of the flowing liquid bent the individual fibers, which were treated as cantilever beams. The fiber stiffness was calculated from the suspended fiber length, the flow velocity, and the deflection of the fiber end. Silicone as a fluent enabled the analysis of fibers with different moisture contents. Wet fibers were dried to the target moisture content before adding them to the flowing liquid. For the measurement of totally wet fibers, water was used as the fluent.
Saketi and Kallio (2011) developed a method capable of measuring the flexibility of dry and wet fibers. A single fiber was clamped at both ends using a microrobotic device. A load cell was pressed against the center of the fixed fiber. A position sensor was used to measure the deflection of the bent fiber, and together with the applied force and the fiber length, the bending stiffness was calculated. In their study, Saketi and Kallio used bleached pine kraft pulp fibers that were peeled to the S2 layer and soaked in water for 5 min. A bending stiffness of 1.2 ∙ 10-10 Nm² was measured for softwood fibers with zero axial tension.
Wet bending stiffness measurements
The bending stiffness of a single wet fiber is usually obtained by measuring the wet fiber’s flexibility in a flow cell device and calculating its reciprocal, which is the wet bending stiffness (Kuhn et al. 1995; Paavilainen 1993; Robertson et al. 1961; Steadman and Luner 1985; Tam Doo and Kerekes 1982; Yan et al. 2008).
Tam Doo and Kerekes (1982) presented a method where they placed a single fiber above a notched tip in a capillary tube. The force was introduced to the fiber by water flowing into the tube and deflecting the fiber. Fiber deflection was measured using a microscope, and fiber flexibility was calculated therefrom.
Steadman and Luner (1985) established a method where a thin fiber network was formed and pressed on a glass slide that had several steel wires on its surface. The network was dried, and fibers that crossed the steel wires were analyzed using a microscope with transmitted and incident light. The fiber flexibility was calculated from the wire diameter, the pressing pressure, the projected fiber width, and an estimate of the loaded fiber span adjacent to the wire that was not in contact with the glass slide. According to Paavilainen (1993), Steadman and Luner’s method is the least tedious measurement for wet fiber flexibility and it correlates with Tam Doo and Kerekes’ method.
The methods of Steadman and Luner and Tam Doo and Kerekes were also applied by Paavilainen (1993). She analyzed pine and spruce pulp fibers regarding their wet flexibility and collapsibility as a result of different fiber treatments, such as cooking, bleaching, drying, and refining. The pulps were fractionated into different cell wall thicknesses, which corresponded with the original early- to summerwood contents.
Robertson et al. (1961) developed an apparatus with two concentric cylinders rotating in opposite directions, which induced a laminar shear to a fiber suspension. Individual fibers were categorized according to their rotational behavior in different classes of orbits using a light microscope. Each class described a different degree of fiber deformation. Categorizing depended on fiber length because only long fibers can form large orbits. Short fibers cannot be analyzed by this method. A flexibility index was calculated representing the percentage of flexible fibers in the population.
Kuhn et al. (1995) developed an apparatus where a fiber suspension flows through a capillary, which leads orthogonally into a flow cell channel in a T-junction configuration. Single fibers exiting the capillary into the main channel were bent by the force of the flow. The deflection of a single fiber was detected by a microscope, and its flexibility was calculated using standard beam theory.
Yan et al. (2008) modified the method of Steadman and analyzed mechanical pulp using a CLSM.
Eckhart et al. (2009) developed a method for single fiber flexibility measurements providing fiber flexibility distributions. The flow cell they used induced high shear forces in a laminar flow regime by heading two streams of identical flow rate against each other in a crossing. The fiber movement was recorded by a high-speed camera and analyzed using image analysis software. The flexibility parameter determined for each single fiber is based on the relationship between the deformation of the measured fiber (Reaction) and the deformation of the same fiber assumed to be ideally elastic (Load).
Waterhouse and Page (2004) reviewed the deformation behavior of wet fibers regarding the contribution of transverse shear. Assuming that wet fibers deform in pure bending, expressing the fiber flexibility only by 1 / E · I is incorrect, according to them. They showed that shear deformation always contributes to wet fiber deformation, which makes it difficult, if not impossible, to determine wet bending stiffness based on wet fiber deformation.
The impact of shear deformation depends on the open span length of the fiber (Yan and Li 2008). The reason is that shear deformation increases linearly with span length, whereas bending deformation increases by the second power of the span length. According to Yan and Li (2008) for short span lengths below 100 µm, shear deformation accounts for 60 to 95% of the deformation of wet pulp fibers. For long span length above 1 mm, that means that bending accounts for at least 90% of the deformation.
EXPERIMENTAL
Materials
All tests were performed using an unrefined, unbleached softwood kraft pulp (mixture of spruce and pine; -number 42) which was once-dried. The mechanical properties of single fibers were determined using the method developed by Fischer et al. (2012). Individual fibers were prepared according to the method of Kappel et al. (2009).
Single Fiber Tensile Testing (SFTT)
To determine tensile strength, individual fibers were fixed to a sample holder using a two-component glue (UHU® PLUS Sofortfest, UHU Gmbh, Germany). After hardening of the adhesive, the sample holder was mounted to the testing device and bridges A and B (Fig. 4a) were melted using a soldering rod. In the final step, the individual fibers were loaded (loading rate 2 µm/s) to failure. This was done by pulling away part 2 from part 1 (Fig. 4b). The loading force during testing was recorded.

Fig. 4. Determination of the single fiber tensile strength
The testing procedure was filmed, and the images were used to determine the exact initial fiber length l0 as well as the length directly before breaking, l1 (Fig. 5).

Fig. 5. Determination of the fiber elongation
The length values were used to calculate the elongation of the tested fiber according to Eq. 5.
 (5)
(5)
Results from fibers that broke at the point of fixation were excluded. Misalignment of the fibers (when the angle between the sample holder edge and the fiber axis was not 90°) and curing of the adhesive may introduce stress concentrations in this region, which in turn influences the breaking load, the stress acting on the fiber cross section (![]() , see Eq. 6), the fiber elongation, and finally the modulus of elasticity.
, see Eq. 6), the fiber elongation, and finally the modulus of elasticity.
The results of the single fiber tensile tests (Fbreak, strain to failure ![]() ), in combination with the cross sectional area (Across, I) obtained from the serial sectioning technique (see following section), were used to calculate the E-modulus and the theoretical bending stiffness of a single fiber in the dry state (see Eqs. 7 to 9). For a fiber that has an elliptical shape, this is done as follows:
), in combination with the cross sectional area (Across, I) obtained from the serial sectioning technique (see following section), were used to calculate the E-modulus and the theoretical bending stiffness of a single fiber in the dry state (see Eqs. 7 to 9). For a fiber that has an elliptical shape, this is done as follows:

The loading situation used for measurements in the present work is shown by the fiber at the right-hand side in Fig. 3, so the applicable area moment of inertia is Iz. The fibers are lying flat in the bending plane, so that the bending stiffness is maximal.
Determination of Fiber Cross Sectional Properties
This analysis is divided into two parts. In the first part, the fiber was digitized, and in the second part, the obtained images of the fiber cross section were analyzed.
Fiber digitization
For the analysis of the fiber’s cross sectional area (Across) and its moments of inertia (Iy and Iz), we applied an automated serial sectioning technique. After measuring the E-modulus of the fiber using the single fiber tensile tester, the two fiber fragments were embedded in resin and sliced by an automated microtome. The digital images were delivered by a fully automated system (Wiltsche et al.2011) using an incident light optical microscope and a CCD camera for digitization. The light optical microscope had a magnification of 50 times, resulting in a pixel size of 0.161 μm/pixel and an optical resolution of 0.61 μm/pixel. A typical result for an image set after fiber digitization is shown in Fig. 6.
Fiber cross section image analysis
For digitization, the outlines for the individual fiber cross sections were drawn manually for each image in the sequence. The cross sections could now be connected through the stack of slices, enabling a reconstruction of the digitized three-dimensional (3D) fiber. From the 3D data, the fibers’ orientation in both the cross direction (Y) and in the direction of the sample thickness (X) could be determined. Fibers that were not oriented perpendicular to the cutting plane were corrected automatically according to the fibers tilting angles so that their cross sections were not overrated using the procedure described by Lorbach et al. (2012).
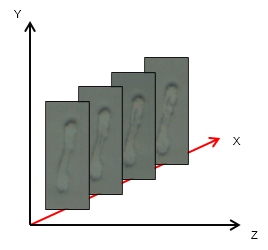
Fig. 6. Example of 3D digital imaging of a fiber cross section using the serial sectioning method; cutting distance in X = 1 µm, and Y and Z are coordinates in the image plane
The measurement of the fiber cross sectional area and the moments of inertia (Iy and Iz) was conducted using MATLAB. Pixel size and number of pixels were taken to calculate the cross sectional area. The average of all cross sectional areas of a single fiber was used in this study. For the detection of the fiber’s moments of inertia, the MATLAB function “regionprops” was employed. Because pulp fibers are shaped similar to ellipses, an ellipse with the same second moments as the fiber cross sectional area was used to estimate the distances a (half fiber width) and b (half fiber thickness) of the fiber cross section. Equation 2 was applied to calculate the moments of inertia Iy and Iz (Fig. 3).
Determination of Fiber Bending Stiffness
For the determination of the individual fiber bending stiffness, the single fiber testing instrument and the procedure for obtaining the bending stiffness as described by Fischer et al. (2012) was used. The fiber-fiber joint configuration was as illustrated in Fig. 7a. In this case, one end of each fiber was glued to a custom-designed sample holder.

Fig. 7. Determination of fiber bending stiffness
The longitudinal fiber was pulled upwards, and the cross fiber was deflected (Fig. 7b). The whole testing procedure was filmed, and these videos were converted to individual images. The images were used to determine the free fiber length l as well as the maximum deflection wmax (at the end of the fiber; Fig. 7b). The result obtained in this test applied to Eq. 10 gives the bending stiffness of a single fiber (Fischer et al. 2012).
 (10)
(10)
Determination of E-modulus using Dynamic Mechanical Analysis (DMA)
To verify the E-modulus values, the unrefined, unbleached softwood kraft pulp fibers were evaluated at 50% relative humidity (RH) and 23 °C using DMA. These tests were performed using a DMA Q800-RH (TA Instruments, USA) under tensile geometry in transient mode. Fibers fixed to the special sample holder (Fig. 4) with a length of 1 mm were mounted to the DMA with a gauge length of 5 to 6 mm. A preload force of 0.001 N and a relative humidity of 50% RH for 55 min was applied to the sample prior to control force testing with a ramp-force of 1 N min-1 until probe fracture. The E-modulus of five unbleached softwood kraft pulp fibers at 50% RH and 23 °C was determined.
Calculation of Wet Fiber Properties
To date, most studies regarding the modulus of elasticity and the size of the fiber cross section have primarily been concerned with the determination of Edry and Across dry in the dry state. There is little in the literature concerning Ewet and Across wet. In this section, a model for calculating the modulus of elasticity, the cross sectional area, and the theoretical bending stiffness in the wet state is presented. The model is based on data obtained in other studies. An important assumption is that the fibers are expected to be fully collapsed in the wet and the dry states, i.e., the fibers have no lumen. In this study, 94% of the fibers in the softwood pulp were found to be fully collapsed, as reported in an earlier study, and the remaining 6% of fibers were found to be highly collapsed (Lorbach et al. 2012).
Wet fiber cross sectional area
To determine the increase in the fiber cross sectional area Across due to swelling, microtome cross sections of dry fibers at 50% relative humidity were compared to those in the wet and swollen state. The wet fibers were soaked in deionized water for 3 h and then freeze-dried to preserve the shape of the swollen fiber wall (compare Enomae and Lepoutre 1998). A comparison of the fiber wall area mean values in the wet and dry states is presented in Table 1. For Across dry, 280 cross sections of unbleached softwood kraft pulp fibers were analyzed. For Across wet, 129 cross sections of the same fiber population were analyzed.
Table 1. Results of Dry and Wet Fiber Cross Sections

The results shown in Table 1 were used to calculate the increase in the cross sectional area due to swelling. The swelling factor S was determined using Eq. 11.
 (11)
(11)
Taking the data from Table 1 gives a resulting swelling factor of 19.5% for the softwood pulp investigated in this study. That is, there was a 19.5% increase in fiber cross sectional area due to swelling in water. To determine the area moment of inertia in the wet state, it was assumed that swelling takes place with preservation of the cross sectional shape, i.e., the fiber cross section was assumed to grow by 19.5% without any change in shape. From that enlarged fiber cross section, the area moment of inertia was calculated.
Wet fiber elastic modulus
The results obtained by Kersavage (1973) were used to estimate the reduction of the modulus of elasticity. Using the values shown in Table 2, an E-modulus of 28.98 GPa at 50% RH (E50% R.H.) was determined by interpolation of the data.
Table 2. Results of Kersavage (1973)

The modulus of elasticity in the dry state (E 50% R.H.) in conjunction with the E-modulus in the wet state (E wet) was used to calculate the reduction of the elastic modulus (Eq. 12).
 (12)
(12)
In the present work, the results obtained by Kersavage (1973), measurements of the dry and wet fiber cross sections with the microtome, and the model assumption described above were used to estimate the reduction of E (47%) due to the influence of water. Furthermore, the E-modulus in the wet state in combination with investigations of the wet fiber cross section were used to give an estimate of the bending stiffness of wet fibers.
RESULTS AND DISCUSSION
E-modulus
Table 3 shows the results of the tensile strength measurements and the mean cross sectional area.
Table 3. Results of Single Fiber Tensile Testing (SFTT), DMA, and Cross Sectional Analysis in the Dry State

The fiber’s tensile strength, the breaking force, and the strain were determined. To calculate the E-modulus, the area of the fiber’s cross section to which the force was applied had to be known. Because the cross sectional areas of the fibers tested was not analyzed, a mean cross sectional area of the same fiber population measured elsewhere (Lorbach et al. 2012) was taken. A mean fiber cross sectional area of 154 µm² (Table 3) was derived from 28 fibers, which were cut over 10 slices (280 cross sections). Five fibers were used for the tensile strength measurement, obtaining a mean E-modulus of 20.23 GPa. For the DMA measurement, we also analyzed five fibers, which had a mean E-modulus of 16.84 GPa (Table 3). The results of the DMA and SFTT measurements conducted in this study were in agreement with each other and with the results of similar experiments found in the literature (Fig. 8).
A comparison (Fig. 8) between the E-modulus of single fibers detected in this study and those obtained in earlier studies shows that the values are within the same range.

Fig. 8. Comparison of single pulp fibers’ E-modulus from literature and present study
Variations in the E-modulus can be explained by the method used for fixing and testing the individual fibers and natural or induced (due to handling) fiber defects, as well as differences in fiber size and in the fibril angle of secondary cell wall two (S2).
The E-modulus in the wet state was calculated according to the method discussed above. Using the model assumption, the dry E-modulus was reduced by about 46.55% to obtain the fiber’s E-modulus in the wet state. This leads to a mean wet E-modulus of about 10.80 GPa (SFTT) and 9.00 GPa (DMA).
Area Moment of Inertia and Cross Sectional Area
In this study, three individual softwood kraft pulp fibers were analyzed. For each of these fibers, the cross sectional area was determined and the moments of inertia Iy and Iz resulting from the elliptical shape of the fiber were estimated. Cross sections ranging from 206 to 318 µm² were measured. The moments of inertia Iyranged from 3.7 ∙ 10-22 to 2.81 ∙ 10-21 m4, and for Iz, we measured values from 1.29 ∙ 10-20 to 4.84 ∙ 10-20 m4.
Dry Fiber Bending Stiffness
The bending stiffness values obtained from single fiber testing were in the range from 5.333 ∙ 10-11 to 1.1724 ∙ 10-9 Nm². The results are plotted on the left side of Fig. 9. The boxplots comprise the 25% to 75% quartiles, and the whiskers represent the minimum and maximum value and the line represents the median value. Three fibers were analyzed by calculation of E ∙ I, and four fibers were measured using single fiber testing. The mean bending stiffness was determined to be 4.61 ∙ 10-10 Nm².
Figure 9 also shows the bending stiffness calculated from moments of inertia Iy and Iz and the measured E-moduli of the corresponding fibers. The theoretical bending stiffness E ∙ Iy was calculated to reach a mean of 2.21 ∙ 10-11 Nm². The theoretical bending stiffness E ∙ Iywas obviously lower than the measured bending stiffness. This can be explained by the testing procedure for the bending stiffness measurement (Fig. 3 and Fig. 7). As explained above, the test bends the fiber, inducing only moment Iz because the test permits no twisting or turning of the cross fiber. Thus, the measured bending stiffness results have to be compared to the theoretical bending stiffness E ∙ Iz; they show good agreement. We calculated a mean E ∙ Iz of 4.29 ∙ 10-10 Nm² compared to the mean measured bending stiffness of 4.61 ∙ 10-10 Nm² (Fig. 9).

Fig. 9. Fiber bending stiffness measured for 4 fibers from fiber testing (left) and calculated for 3 fibers from E-modulus and area moment of inertia (right)
Wet Fiber Bending Stiffness
Figure 10 shows a comparison between the theoretical dry and the theoretical wet bending stiffness of single fibers. As expected, the calculations show a great difference between the bending stiffness values E ∙ Iy and E ∙ Iz for dry state and wet state estimations. This is due to the highly different values for the moments Iy and Iz. Also expected is the lower bending stiffness values of the fibers in the wet state, as calculated from E and I. This is due to the lower E-modulus in the wet state, as described above. The reduction of the E-modulus is greater than the increase in the area moment of inertia by swelling of the fiber, resulting in an overall reduction of the theoretical bending stiffness in the wet state. For E ∙ Iz, we obtained a mean of 4.29 ∙ 10-10 Nm² in the dry state and 2.92 ∙ 10-10 Nm² in the wet state.
Figure 10 shows the calculated E ∙ Iy values for the dry and wet states. In the dry state, we obtained a mean of 2.21 ∙ 10-11 Nm²; in the wet state, the value was 1.62 ∙ 10-11 Nm².

Fig. 10. Comparison of calculated bending stiffness in dry and wet states (3 fibers)

Fig. 11. Comparison of wet bending stiffness values
Figure 11 shows a comparison of the wet bending stiffness values from the present study and results from literature. Our results show good agreement for E ∙ Iy, but considerable differences in E ∙ Iz. We measured a mean value of 2.92 ∙ 10-10 Nm² for E ∙ Iz.
There is a straightforward explanation for these results. Wet bending stiffness (1/wet fiber flexibility) is mostly measured by flow cell methods by exerting the bending force toward the flat side of the collapsed fiber (side of fiber width, Fig. 3 left fiber), inducing a moment that corresponds to the moment of inertia Iy calculated in this study (Kuhn et al. 1995; Paavilainen 1993; Robertson et al. 1961; Steadman and Luner 1985; Tam Doo and Kerekes 1982; Yan et al.2008). This is because the suspended fiber is bent by the load of a water stream in flow cell devices, which deforms the fiber. The tested fiber is free to twist in the water current, and it always bends in the direction giving the least resistance to the current, which is the direction with the minimum bending resistance, i.e., Iy. Thus, flow cell devices provide the lowest possible values for bending stiffness.
CONCLUSIONS
- In this paper, we have proposed an alternative method to determine fiber bending stiffness. Measuring the fiber’s E-modulus (E) and the area moment of inertia (I) of the fiber cross section, we calculate the fiber’s bending stiffness (E ∙ I) according to beam theory. The proposed method can be applied for dry and wet fibers. This provides an effective and efficient way to calculate the dry and wet bending stiffness, which normally has to be measured using tedious methods such as single fiber testing and flow cell techniques.
- We have compared bending stiffness values E ∙ I calculated from the E-modulus and area moment of inertia to tested values. The measured bending stiffness in the dry state agrees well with E ∙ Iz, which is the exact type of loading in the single fiber testing experiments. The bending stiffness in the wet state, E ∙ Iy, agrees well with values reported in the literature, which, in our opinion, reflects the loading situation of the fibers in the flow cell devices used for direct measurement of wet fiber bending stiffness.
- We see a large benefit in the fact that an estimate for wet fiber bending stiffness can be provided based on analysis of the dryfiber cross sectional morphology.
ACKNOWLEDGEMENTS
The authors would like to thank the Austrian Science Fund (FWF), grant number P-22261-N22, for funding this work. Furthermore, we would like to thank Mondi and the Austrian Federal Ministry of Economy, Family, and Youth, and the National Foundation for Research, Technology, and Development.
REFERENCES CITED
Adusumalli, R. B., Müller, U., Weber, H., Roeder, T., Sixta, H., and Gindl, W. (2006). “Tensile testing of single regenerated cellulose fibres,” Macromol. Symp. 244, 83-88.
Clark, J. d’A. (1969). “Fibrillation, free water, and fiber bonding,” TAPPI J. 52(2), 335-340.
Clark, J.d’A. (1985). Pulp Technology and Treatment for Paper, 2ndEdition, Miller Freeman Publications, San Francisco.
Das, A., Ishtiaque, S. M., Singh, S., and Meena, H. C. (2009). “Tensile characteristics of yarns in wet condition,” Indian J. Fibre Text. 34(4), 338-344.
Duncker, B., Hartler, N., and Samuelsson, L. G. (1966). “Effect of drying on the mechanical properties of pulp fibres,” in: Consolidation of the Paper Web Volume 1, F. Bolam (ed.), Technical Section of the British Paper and Board Makers’ Association, London, pp. 529-537.
Eckhart, R., Donoser, M., and Bauer, W. (2009). “Single fibre flexibility measurement in a flow cell based device,” Advances in Pulp and Paper Research, Volume 1, S. J. I’Anson (ed.), The Pulp and Paper Fundamental Research Society, Oxford, pp. 247-271.
Ehrnrooth, E. M. L., and Kolseth, P. (1984). “The tensile testing of single wood pulp fibers in air and in water,” Wood Fiber Sci. 16(4), 549-566.
Enomae, T., and Lepoutre, P. (1998). “Observation of the swelling behavior of kraft and sheets in the environment scanning electron microscope,” Nord. Pulp Paper Res. 13(4), 280-284.
Fischer, W. J., Hirn, U., Bauer, W., and Schennach, R. (2012). “Testing of individual fiber-fiber joints under biaxial load and simultaneous analysis of deformation,” Nord. Pulp Paper Res. 27(2), 237-244.
Forseth, T., and Helle, T. (1997). “Effect of moistening on cross-sectional details of calendered paper containing mechanical pulp,” J. Pulp Pap. Sci. 23(3), 95-100.
Groom, L., Mott, L., and Shaler, S. (2002). “Mechanical properties of individual southern pine fibers. Part I. Determination and variability of stress-strain curves with respect to tree height and juvenility,” Wood Fiber Sci. 34(1), 14-27.
Helle, T. (1978). “How forming fabric design affects drainage and release,” Pulp Pap.-Canada 79(11), 91-98.
Jayne, B. A. (1959). “Mechanical properties of wood fiber,” TAPPI J.42(6), 461-467.
Kallmes, O. J., and Perez, M. (1966). “Load/elongation properties of fibres,” in: Consolidation of the Paper Web, Volume 1, F. Bolam (ed.), Technical Section of the British Paper and Board Makers’ Association, London, pp. 507-528.
Kappel, L., Hirn, U., Bauer, W., and Schennach, R. (2009). “A novel method for the determination of bonded area of individual fiber-fiber bonds,” Nord. Pulp Paper Res. 24(2), 199-205.
Kersavage, P. C. (1973). “Moisture content effect on tensile properties of individual Douglas-fir latewood tracheids,” Wood Fiber5(2), 105-117.
Kuhn, D. C. S., Lu, X., Olson, J. A., and Robertson, A. G. (1995). “A dynamic wet fibre flexibility measurement device,” J. Pulp Pap. Sci.21(10), J337-J342.
Lorbach, C., Hirn, U., Kritzinger, J., and Bauer, W. (2012). “Automated 3D measurement of fiber cross section morphology in handsheets,” Nord. Pulp Paper Res. 27(2), 264-269.
Mott, L., Groom, L., and Shaler, S. (2002). “Mechanical properties of individual southern pine fibers. Part II. Comparison of earlywood and latewood fibers with respect to tree height and juvenility,” Wood Fiber Sci. 34(2), 221-237.
Navaranjan, N., Richardson, J. D., Dickson, A. R., Blaikie, R. J., and Prabhu, A. N. (2007). “A new method for the measurement of longitudinal fibre flexibility,” 61st Appita Annual Conference and Exhibition, Gold Coast, Australia, Appita Inc., pp. 267-273.
Paavilainen, L. (1993). “Conformability – flexibility and collapsibility – of sulphate pulp fibres,” Pap. Puu-Pap. Tim. 75(9), 689-702.
Page, D. H., El-Hosseiny, F., Winkler, K., and Lancaster, A. P. S. (1977). “Elastic modulus of single wood pulp fibers,” TAPPI J. 60(4), 114-117.
Robertson, A. A., Meindersma, E., and Mason, S. G. (1961). “The measurement of fibre flexibility,” Pulp Paper Mag. Can. 62(1), T3-T10.
Saketi, P., and Kallio, P. (2011). “Microrobotic platform for manipulation and mechanical characterization of individual paper fibers,” Fine Structure of Papermaking Fibres, COST Action E54, “Characterization of the fine structure and properties of papermaking fibres using new technology,” P. Ander (ed.), COST Office, Brussels.
Samuelsson, L.-G. (1963). “Measurement of the stiffness of fibres,” Sven. Papperstidn. 66(15), 541-546.
Schniewind, A. P., Ifju, G., and Brink, D. L. (1966). “Effect of drying on the flexural rigidity of single fibres,” in: Consolidation of the Paper Web, Volume 1, F. Bolam (ed.), Technical Section of the British Paper and Board Makers’ Association, London, pp. 538-543.
Schnell, W., Gross, D., and Hauger, W. (1995). Technische Mechanik 2 Elastostatik, 5th Edition, Springer, Berlin.
Seborg, C. O., and Simmonds, F. A. (1941). “Measurement of the stiffness in bending of single fibers,” Paper Trade J. 113(17), 49-50.
Sedlachek, K. M. (1995). “The effect of hemicelluloses and cyclic humidity on the creep of single fibers,” PhD thesis, Institute of Paper Science and Technology, Atlanta, GA.
Spiegelberg, H. L. (1966). “The effect of hemicelluloses on the mechanical properties of individual pulp fibers,” PhD thesis, Institute of Paper Chemistry, Appleton, Wisconsin.
Steadman, R., and Luner, P. (1985). “The effect of wet fibre flexibility of sheet apparent density,” in: Papermaking Raw Materials, Volume 1, V. Punton (ed.), Mechanical Engineering Publications Limited, London, pp. 311-337.
Tam Doo, P. A., and Kerekes, R. J. (1981). “A method to measure wet fiber flexibility,” Tappi J. 64(3), 113-116.
Tam Doo, P. A., and Kerekes, R. J. (1982). “The flexibility of wet pulp fibres,” Pulp Pap.-Canada 83(2), 46-50.
Torgnysdotter, A., and Wågberg, L. (2004). “Influence of electrostatic interactions on fibre/fibre joint and paper strength,” Nord. Pulp Paper Res. 19(4), 440-447.
Waterhouse, J. F., and Page, D. H. (2004). “The contribution of transverse shear to wet fiber deformation behavior,” Nord. Pulp Paper Res. 19(1), 89-92.
Wiltsche, M., Donoser, M., Kritzinger, J. and Bauer, W. (2011). “Automated serial sectioning applied to 3D paper structure analysis,” J. Microscop. 242(2), 197-205.
Yan, D., Li, K., and Zhou, Y. (2008). “Measurement of wet fiber flexibility of mechanical pulp fibers by confocal laser scanning microscopy,” TAPPI J. 7(1), 25-31.
Yan, D. and Li, K. (2008). “Wet fiber shear flexibility and its contribution to the overall transverse deformation of fibers,” J. Mater. Sci. 43, 7210-7218.
Article submitted: March 7, 2014; Peer review completed: April 26, 2014; Revised version received and accepted: July 6, 2014; Published: July 23, 2014.