
Abstract
Raw biomass is not commonly suitable as feedstock for existing power plants, mainly because of the substantial required infrastructural changes. As a result, most raw feedstock requires pre-treatment to improve its physical and thermal characteristics. Biomass carbonization is one of the pre-treatments that produces charcoal-like feedstock. This paper explores the effects of the carbonization process on the physiochemical characteristics of biomass produced from two cottonwood clones, S7C20 and ST66, and switchgrass (var. Alamo). Additionally, it studies the thermal degradation kinetics of raw and carbonized agroforestry products in nitrogen and air environments. Feedstock samples were carbonized in a batch reactor at 400 °C in an oxygen-free environment for 2 hours. Carbonization decreased biomass bulk density, moisture content, and volatile solids while increasing fixed carbon, ash content, pH, and heating values. The heating value of S7C20, ST66, and switchgrass increased by 58.6%, 60.3%, and 69.7%, respectively. Carbonization increased the activation energy values under the condition of pyrolysis and decreased these values under the condition of combustion. The carbonization process produced a charcoal-like feedstock that may be processed with coal or even replace it.
Download PDF
Full Article
Pyrolysis and Combustion Kinetics of Raw and Carbonized Cottonwood and Switchgrass Agroforests
Sammy Sadaka,a,* Hal Liechty,b Matt Pelkki,b and Michael Blazier c
Raw biomass is not commonly suitable as feedstock for existing power plants, mainly because of the substantial required infrastructural changes. As a result, most raw feedstock requires pre-treatment to improve its physical and thermal characteristics. Biomass carbonization is one of the pre-treatments that produces charcoal-like feedstock. This paper explores the effects of the carbonization process on the physiochemical characteristics of biomass produced from two cottonwood clones, S7C20 and ST66, and switchgrass (var. Alamo). Additionally, it studies the thermal degradation kinetics of raw and carbonized agroforestry products in nitrogen and air environments. Feedstock samples were carbonized in a batch reactor at 400 °C in an oxygen-free environment for 2 hours. Carbonization decreased biomass bulk density, moisture content, and volatile solids while increasing fixed carbon, ash content, pH, and heating values. The heating value of S7C20, ST66, and switchgrass increased by 58.6%, 60.3%, and 69.7%, respectively. Carbonization increased the activation energy values under the condition of pyrolysis and decreased these values under the condition of combustion. The carbonization process produced a charcoal-like feedstock that may be processed with coal or even replace it.
Keywords: TGA; Thermochemical; Carbonization; Oxidation; Thermal degradation
Contact information: a: Department of Bio. & Agric. Eng. University of Arkansas Division of Agriculture, Little Rock, AR; b: School of Forest Resources, University of Arkansas at Monticello; c: Northwest Region, Hill Farm Research Station, Louisiana State University, Homer, LA;
* Corresponding author: ssadaka@uaex.edu; Tel: 501- 671- 2298; Fax: 501-671-2303
INTRODUCTION
Recently, the United States Environmental Protection Agency circulated the Clean Power Plan proposal, which sets a target of cutting 25% of carbon pollution from power plants by the year 2030 (USEPA 2014). Power plants are among the largest sources of carbon pollution in the United States. As a result, power plants and industries are exploring the use of biomass as an option for renewable portfolio standards compliance. The challenge is to produce biomass in such a way as to reduce global warming pollution, protect the environment, and sustain food and feed prices. Agroforests, which have the potential to be an economically and ecologically friendly cropping system on low-productivity agricultural land, could be a promising source of biomass (Tripp et al. 2009). The Lower Mississippi Alluvial Valley (LMAV) is a region with a high potential for producing biomass crops via agroforestry because of its well-developed agricultural infrastructure (Liechty et al. 2012). Cottonwood-switchgrass agroforests would provide an annually harvested crop (switchgrass) and a perennial crop (cottonwood) that could be managed on a fixed harvesting schedule to take advantage of variations in bioenergy or other product markets. The biomass grown in agroforestry could be co-fired with coal. Co-firing has the potential to reduce CO2 emissions from coal-fueled plants.
The nature and chemical composition of raw biomass, mainly grass, can lead to significant increases in infrastructural cost, as well as reactor slagging and fouling issues. The amelioration of the physiochemical properties of raw biomass via thermochemical treatments, e.g., torrefaction and carbonization, would enhance their acceptance in the national and international bioenergy market (Sadaka and Negi 2009). Additionally, concentrating their energy densities could make biomass more economically viable. This would likely increase the demand for biomass in the U.S. and European bioenergy markets, as well as enhance the value of these crops for farmers and producers. Torrefaction is a thermochemical conversion process that converts raw biomass into highly concentrated energy and frail feedstock. It takes place at moderate temperatures between 280 and 320 °C in an oxygen-free environment (Bergman 2005). On the other hand, carbonization, which takes place at higher temperatures (400 to 500 °C), produces a charcoal-like feedstock from raw biomass (Malghani et al.2013). During the torrefaction process, biomass partially decomposes and undergoes some physical changes by losing all of its water and some of its volatile matter and thus becomes a frail material known as biochar (Bergman et al. 2005). During the carbonization process, biomass chemical bonds break down and produce a charcoal-like material, combustible gases, and tar (Sadaka et al. 2014). Thus, it is a thermochemical process applied in the absence of oxygen to break down the complex substances in biomass into elemental carbon and chemical components. Accordingly, this technique can produce biomass with properties comparable with coal, and makes biomass feedstocks amenable to co-firing. This process could be used efficiently and economically to convert agroforestry products into charcoal.
A survey of the available literature shows that there is a need for evaluating the physiochemical and thermal characteristics of charcoaled agroforestry products. Additionally, there is a need for more in-depth exploitation of the kinetic parameters of charcoaled agroforestry products. Characterization of the charcoaled biomass would provide the required data needed to guide the handling and utilization of these products during thermochemical conversion processes. Additionally, the determination of their kinetic parameters, i.e., activation energy and pre-exponential factors in an inert and/or oxidizing environment would motivate their conversion via the pyrolysis and combustion processes. Therefore, the main goals of this research were: (a) to explore the effects of carbonization treatment on the physical, chemical, and thermal characteristics of charcoal produced from two cottonwood clones, namely S7C20 and ST66, as well as switchgrass; and (b) to study the thermal degradation kinetics of the raw and carbonized agroforestry products in nitrogen and air environments.
EXPERIMENTAL
Biomass Collection and Preparation
Three 200-kg bales of switchgrass (Alamo variety) were harvested in late September, 2012 from the University of Arkansas research site (Pine Tree Branch Station, Colt, AR, U.S.) and stored until needed. The required amount of switchgrass from each bale was chopped using a three-horsepower 220-volt/single phase hammer mill (Pellet Pros Inc., IA, U.S.) and dried in a kiln at 60 °C for 24 h. Additionally, two cottonwood clones, S7C20 and ST66, were analyzed in this study. These clones originated from different portions of the natural range of eastern cottonwood. Clone S7C20 was from Texas and clone ST66 was from Mississippi. The cottonwood trees were harvested in winter (no leaves), and the branches were separated from the main stem by clone type. The branches were chipped in a small chipper/shredder, while the main boles were chipped using a tractor-mounted PTO-driven wood chipper. All chipped biomass was dried for 48 h at a low temperature of 60 °C in a rotating wire mesh drum. One composite large-size subsample (110 L) was mixed from various containers assigned to each clone. The subsamples were mixed thoroughly to ensure representative samples of each category.
Feedstock Carbonization
Three 3.78-L metal containers were filled with 400 g of composite samples from each type of feedstock. These samples were compacted to ensure that air within the voids was maintained at a minimal level. Following compaction, the lid was secured in its place. A 6-mm stainless steel pipe was secured to the lid to allow the volatile matter to escape from the reactor. The other end of the pipe was attached to a 2.54-cm stainless steel condenser to condense the water and tar. The condenser was placed in a 15-cm ID ice bath. On the side of the condenser, a 6-mm pipe was connected to a plastic tube to allow non-condensable gases to escape from the carbonization system. The system was purged with nitrogen gas for 10 min to ensure minimal oxidation of the sample. The carbonization reactor was placed in a muffle furnace at 400 °C for 2 h. The weight loss of the sample was determined by subtracting the final weight of the sample after cooling from its original weight. Subsequently, the condensable liquid was collected in order to determine its weight. The non-condensable gas weight was determined by the difference between the original weight and the weight of the condensable liquid. Following the carbonization process, both carbonized and raw biomass were analyzed for their potential bioenergy performance by determining their physical, chemical, and thermochemical characteristics.
Feedstock Physical Properties
Key physical characteristics include moisture content, volatile solids content, ash content, and fixed carbon content. The results were averaged and tabulated along with the standard division. The biomass bulk density was performed according to ASTM E873-82. It is an important property that affects the volume needed for storage and transportation. The bulk densities of raw and carbonized samples were also determined in triplicates.
Feedstock Chemical Properties
The feedstock chemical properties determined in this study included chemical composition and pH values. An elemental analysis test was performed to measure the percentages of carbon, hydrogen, oxygen, and nitrogen in the raw and carbonized samples according to ASTM D5373-08. Elemental analysis was performed on one sample of the raw and carbonized feedstock. These measurements were determined using an elemental analyzer (CHN analyzer) in an external lab (Huffman laboratory, Colorado, U.S.). Oxygen was determined by subtracting the summation of carbon, hydrogen and nitrogen percentages from 100%. The pH values of the dry, ground feedstock samples were determined by diluting the solids in distilled water with a ratio of 1 g of solids to 10 mL of distilled water. Following, the samples were powerfully mixed. After 0.5 h without disturbing the sample, the pH values were determined. A pH probe connected to an Omega pH meter was used to measure the pH levels. The pH values of raw and carbonized samples were determined in triplicates.
Feedstock Thermochemical Properties
The feedstock thermochemical properties evaluated in this study include carbonization products, heating values, and thermal decomposition performance. An oxygen bomb calorimeter (Parr® instruments, Moline, IL) was used to determine the heating values of both raw and carbonized samples. The net heating value of the carbonized feedstock was determined by multiplying the remaining weight after carbonizing 1 kg of raw material by its final heating value.
Thermogravimetric analysis was performed for raw and carbonized cottonwood clones S7C20 and ST66, as well as switchgrass to study the changes in weight with respect to changes in sample temperature. Thermogravimetric tests were carried out on finely-ground samples (dp<63 μm) in a thermogravimetric analyzer (TGA 4000-PerkinElmer, Waltham, MA) in both nitrogen and air environments. The sample weight loss was continuously monitored under three heating rates of 20, 30, and 40 °C/min until the sample temperature reached 800 °C. The decomposition rate (dW/dt) can be expressed using the Arrhenius equation as a function of the pre-exponential factor (A), the activation energy (Ea), and temperature (T) (Eq. 1),
 (1)
(1)
where W is the sample weight (mg), t is the reaction time (s), A is the per-exponential factor (s−1), Eais the activation energy (kJ/mol), R is the gas constant (8.314 kJ kmol−1 K−1), T is the reaction temperature (K), and n is the reaction order.
In order to determine the activation energy (Ea) and the pre-exponential factor (A), Kissinger’s method (Kissinger 1956) was used. This method is based on the assumption that the decomposition follows a first-order reaction model. This method uses the maximum decomposition temperatures (Tmax) corresponding to the peak decomposition rates (dW/dt) in thermogravimetric tests with different heating rates (β). Equation (2) details the relationship between Tmax, β, and Ea, and A,
 (2)
(2)
where  the heating rate (°C /min) and Tmax is the maximum temperature (°C). By plotting
 against (1/Tmax), (Ea/R) and ln(AR/Ea) can be determined as the slope and the intercept of the resulting straight line, respectively. From this information, the activation energy and the pre-exponential factor can be determined.
Statistical Analysis
The results were analyzed using JMP® Pro software (version 11.0.0, SAS Institute Inc., Cary, NC). Two-way ANOVA was used to analyze the impact of feedstock type and thermal treatment on the characteristics of biochar.
RESULTS AND DISCUSSION
Physical Characteristics of Raw and Carbonized Cottonwood and Switchgrass
Moisture content and volatile solids
Carbonization reduced the moisture content of cottonwood clones S7C20, ST66, and switchgrass to 1.3%, 1.7%, and 1.3%, respectively, as shown in Table 1. It should be mentioned that the remaining traces of moisture in the carbonized feedstock could be attributed to the utilized procedure. The released moisture was not removed out of the reactor by any carrier gas but instead released by natural conviction. Bergman and Kiel (2005) and Lipinsky et al. (2002) reported that the moisture content of thermally treated biomass via torrefaction (220 to 280 °C) ranges between 1 and 6% on a wet-weight basis. Increasing the biomass temperature to above 100 °C during the carbonization process releases the free water first. A further increase in biomass temperature releases bound moisture from the biomass. The reduction in feedstock moisture content benefits any thermal treatment process because there is less water to evaporate. In addition, it allows easier handling and feeding of the feedstock into a gasifier or a pyrolyzer, as reported by Sadaka (2013).
Table 1 also shows the volatile matter content as affected by the carbonization process for the two cottonwood clones and switchgrass samples. The initial volatile matter contents for cottonwood S7C20 and ST66 were slightly higher than that of switchgrass. Carbonization significantly reduced the volatile solids content of S7C20, ST66, and switchgrass as compared with raw  . Prins et al.(2006) also reported a significant reduction in biomass volatile solids content during thermal treatment. The reduction in volatile solids values can be attributed to the volatilization of the biomass composition, i.e., hemicellulose, cellulose, and lignin. As the biomass temperature increased to the range of 250 to 320 °C, hemicellulose decomposition was highest, while representing the majority of volatilization with only minor decomposition of cellulose and lignin (Prins et al. 2006). Hemicellulose is composed of polysaccharides and is a random amorphous structure with many branches, leading to higher levels of thermal decomposition at relatively low temperatures (Yang 2007). Further increase of the sample temperature to above 320 °C accelerated biomass devolatilization, which may be caused by cellulose decomposition. Cellulose has a long polymer of glucose units without any branches; hence, it is crystalline, strong, and resistant to volatilization.
Ash content and fixed carbon
The effects of carbonization treatment on feedstock ash content and the fixed carbon of cottonwood clones and switchgrass is presented in Table 1. Generally, ash content increased significantly for the two carbonized cottonwood clones and switchgrass samples. Fixed carbon also showed a similar trend, with the most significant change occurring for cottonwood clone ST66 from 20.2% to 68.6%. Switchgrass fixed carbon similarly increased from 21.2% to 63.4%. As mentioned earlier, carbonization drives off hemicellulose and cellulose from the biomass, leading to an overall reduction of the sample weight. This reduction resulted in an increase in the proportions of ash and fixed carbon content.
Table 1. Physical Characteristics of Raw and Carbonized Cottonwood Clones S7C20, ST66, and Switchgrass
 * All results show the average of three replicates along with the standard deviation. Only one composite sample from each feedstock was sent for elemental analysis.
Bulk density
The bulk densities of cottonwood and switchgrass samples were determined before and after carbonization. The highest bulk density (209.0 kg/m3) was found with cottonwood ST66, while the lowest bulk density (108.8 kg/m3) was found with switchgrass (Table 1). Carbonization treatment significantly reduced the bulk density of the two cottonwood clones and switchgrass. The bulk densities of cottonwood S7C20, ST66, and switchgrass decreased by 20.3%, 31.7%, and 19.8%, respectively. This decline was caused by a significant reduction in feedstock moisture and volatile solids content, while the volume of the biomass remained almost constant. Byrne and Nagle (1997) reported an 82% reduction in carbonized wood bulk density from its original value. It should be mentioned that the lower the bulk density, the higher the transportation cost when transportation cost is based on feedstock volume.
Chemical Characteristics of Raw and Carbonized Cottonwood and Switchgrass
Ultimate analysis, chemical formula, and stoichiometric air
Carbon, hydrogen, oxygen, and nitrogen concentrations of the raw and carbonized feedstock are listed in Table 1. The carbonization process increased carbon and nitrogen concentrations and decreased hydrogen and oxygen concentrations. The molecular weights of the raw feedstock cottonwood clones S7C20, ST66, and switchgrass reached 23.68, 23.85, and 23.44, respectively. Carbonization of these feedstocks decreased their molecular weights by 26.7%, 32.7%, and 11.2%, respectively. The stoichiometric air required for complete combustion did not vary considerably with the maximum and minimum values for raw cottonwood ST66 (5.91 kgair/kgbiomass) and switchgrass (6.12 kgair/kgbiomass). Carbonization increased the stoichiometric air required to burn the ameliorated feedstock by 40.7%, 52.7%, and 12.9% for cottonwood clones S7C20, ST66, and switchgrass, respectively. The decrease in oxygen concentration and the increase in carbon concentration resulted in a noticeable reduction in the oxygen-to-carbon (O/C) ratio for carbonized biomass relative to raw biomass.
Figure 1 shows an illustration of the enhancement stages of raw biomass to charcoal using the Van Krevelen diagram (Van Krevelen 1993). Carbonization decreased the atomic O/C and H/C ratios for the three studied types of biomass. As compared with lignite coal #1 and #2, both carbonized cottonwood clones showed lower atomic O/C ratios and comparable H/C values, whereas those of carbonized switchgrass were considerably higher. The O/C ratios of the carbonized feedstocks (0.21 to 0.47) approached that of lignite coal (0.35 to 0.45), as reported by Van Krevelen (1993). It was noticeable that the O/C ratio of the carbonized switchgrass was considerably higher than that of the other two studied feedstocks. These results reveal that carbonized cottonwood can be co-fired with coal or may replace it. Prins et al. (2006) reported that during the carbonization of feedstock, hemicellulose decomposes profoundly, followed by cellulose. Thus, the reduction of the O/C ratio in carbonized fuel would enhance its combustion behavior.
pH
The pH values of raw cottonwood clones S7C20, ST66, and switchgrass ranged from 6.3 to 6.6 (Table 1). The carbonized biomass pH values increased significantly  to a range of 8.2 to 8.8. All carbonized samples had greater pH values than the raw samples because of the reduction of hydrogen concentrations in the biomass samples. Maiti et al. (2006) also found that carbonization increased the pH values of biochar during the thermal treatment of rice husks. Carbonized feedstock with higher pH values could produce near-neutral pH values of bio-oil.
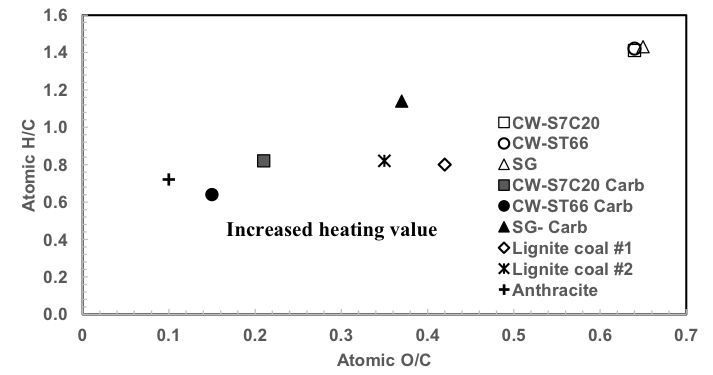
Fig. 1. Van Krevelen Diagram for raw and carbonized feedstock as compared with coal
Thermochemical Characteristics of Raw and Carbonized Cottonwood and Switchgrass
Carbonization products
The carbonization of biomass produced solid products (charcoaled biomass), liquid products (water and tar), and gaseous products (non-combustible and combustible gases). Charcoaled biomass represented 45.7%, 36.9%, and 38.7% of cottonwood clone S7C20, ST66, and switchgrass weights, respectively. The reduction in biomass weight as compared with raw biomass weight can be attributed to the reduction in moisture content and volatile solids. The weight reduction of biomass was noticeably higher for the S7C20 cottonwood clone than for the ST66 clone or switchgrass. Condensable liquids ranged between 35.2% and 29.5% for the three studied feedstocks. Cottonwood S7C20 had the highest percentage of condensable liquid (35.2%), followed by cottonwood ST66 (32.9%) and switchgrass (29.5%). Gaseous products, determined by the difference between the original weight and the weight of condensable liquids, were highest (31.8%) during switchgrass carbonization and reached only 19.1% and 30.2% of the weight of S7C20 and ST66 clones, respectively. Cottonwood clone ST66 and switchgrass released higher amounts of volatile matter during carbonization than cottonwood clone S7C20. Excess volatile matter was released during the carbonization of ST66, resulting in higher values of liquid and gaseous products and less solid yield compared with the other two feedstocks.
Heating value and net heating value
The average heating values for the raw feedstocks are shown in Table 1. The heating values reached 17.6 MJ/kg, 18.0 MJ/kg, and 16.2 MJ/kg for cottonwood clones S7C20, ST66, and switchgrass, respectively. The carbonization of cottonwood S7C20, ST66, and switchgrass increased their heating values by 59.1%, 60.0%, and 69.1%, respectively. This increase in heating values may be attributed to the release of non-combustible vapors and gases from the biomass and increased concentration of the combustible components in the carbonized feedstocks. The mechanisms of the carbonization process described earlier would provide an explanation of the higher-density energy of the carbonized material. Table 1 also shows the net heating value of biochar. The remaining biochar weight values were multiplied by the final heating values to determine the net energy in the final product. The highest net heating value of 12.8 MJ/kg was observed with cottonwood S7C20, whereas that of both cottonwood ST66 and switchgrass reached 10.6 MJ/kg.
Thermogravimetric Analysis of Raw and Carbonized Cottonwood and Switchgrass
Pyrolysis decomposition in the TGA
The TG curves and DTG curves of raw and carbonized cottonwood clones and switchgrass pyrolysis show six distinctive zones over a temperature range of 30 °C to 800 °C (Figs. 2 and 3). Each curve started with a drying zone (up to 110 °C), followed by a heating zone (110 to 250 °C). In the drying zone, there was a slight weight reduction resulting from the evaporation of free water in the biomass. In the heating zone, however, there was a diminutive weight reduction caused by the evaporation of bound water. As such, the biomass cells lost bound water because of the dehydration reaction of hemicellulose and cellulose (Zheng et al. 2012). The third zone (250 to 320 °C), torrefaction, was characterized by moderate to severe weight reduction. The fourth zone (320 to 400 °C), carbonization, was characterized by severe weight reduction. During these latter two zones, the intermolecular and intramolecular hydrogen bonds of hemicellulose and cellulose tended to undergo dehydroxylation, which led to the formation of more moisture and weight reduction. In lignocellulose, i.e., cottonwood and switchgrass, hemicellulose is denoted by the chemical formula (C5H8O4)n, with an O/C ratio of 0.80 (Balat et al. 2008). Cellulose, on the other hand, is denoted by the chemical formula (C6H10O5)n, with an O/C ratio of 0.83 (Demirbas 2005). The cited author reported that reactions such as decarboxylation, glycosidic bond breakage, and C=O group breakage occurred during hemicellulose and cellulose decomposition, forming a set of acids, aldehydes, ethers, and tar substances, as well as gases such as CO and CO2. The fifth zone (400 to 600 °C) and sixth zone  , active and passive pyrolysis, respectively, were characterized by slow, gradual weight reductions. In these zones, C=O group breakage occurred in lignin, forming more acids, aldehydes, and tar substances. During the pyrolysis process, the biomass underwent several stages of dehydration, devolatilization, and depolymerization, with various endothermic reactions taking place. As mentioned earlier, the nature of the three components of biomass, i.e., hemicellulose, cellulose, and lignin, resulted in various decomposition stages during the thermal treatment process within the temperature range of 30 to 800 °C (Phanphanich and Mani 2011).
Increasing the heating rate decreased the peak decomposition for the three studied feedstocks in both raw and carbonized conditions (Table 2). The only two exceptions from the previous observation were found with the carbonized S7C20 and ST66 when doubling the heating rate from 20 to 40 °C /min. It is not known why these two cases were dissimilar to the others. The highest peak decomposition (1.006%/°C) was observed during the pyrolysis of raw cottonwood clone ST66 at 10 °C /min. On the other hand, the lowest peak decomposition (0.764%/°C) was found during the pyrolysis of raw switchgrass at 40 °C /min. It is worth noting that the carbonization of S7C20, ST66, and switchgrass decreased the peak decomposition by 79.9%, 81.5%, and 34.6%, respectively, at a heating rate of 20 oC/min.
Table 2. Pyrolysis, Combustion, and Char Oxidation Peak Decomposition Derivative for Raw and Carbonized Cottonwood Clones and Switchgrass

Table 3 shows the maximum temperature corresponding to peak decomposition for raw and carbonized cottonwood clones S7C20, ST66, and switchgrass during pyrolysis decomposition. Doubling the heating rate during pyrolysis decomposition increased the peak temperature from 7.6 to 9.0 °C, from 4.1 to 7.8 °C, and from 4.0 to 13.3 °C for S7C20, ST66, and switchgrass, respectively.
Table 3. Pyrolysis, Combustion, and Char Oxidation Peak Decomposition Temperatures in Raw and Carbonized Cottonwood Clones and Switchgrass

A maximum peak temperature of 381.3 °C was observed during the decomposition of raw cottonwood S7C20 at the highest heating rate (40 °C /min) under a nitrogen environment. On the other hand, the lowest peak temperature (354.3 °C) was observed during the decomposition of switchgrass under the lowest heating rate (10 °C /min). The peak decomposition temperatures of carbonized samples were lower than the corresponding peak decomposition temperatures of the raw samples in most of the studied cases.
Combustion decomposition in TGA
The TG curves and DTG curves of raw and carbonized cottonwood clones and switchgrass combustion also show six distinctive zones within the temperature range of 30 °C to 800 °C under an air environment, as illustrated in Figs. 4 and 5. Each curve started with a drying zone (up to 110 °C), followed by a heating zone (110 °C to 250 °C). Similar to pyrolysis decomposition, the evaporation of free water in the biomass took place in the drying zone. This caused the small weight reduction in this zone.
Devolatilization of the bounded moisture within the biomass cells is the main reason for the slight weight decrease in the heating zone. Moderate to severe weight reduction categorizes the third zone (280 to 320 °C), the devolatilization of hemicellulose compounds. The DTG curves of the raw feedstocks show a clear shoulder evidencing this phenomenon. The fourth zone (320 to 400 °C) represents the devolatilization of the cellulosic compounds, which can also be characterized by moderate to severe weight reduction, as shown in Figs. 4 and 5. This is clear from the DTG curves, which show a clear peak within this zone. In this zone, the intermolecular and intramolecular hydrogen bonds of hemicellulose and cellulose are inclined to undergo depolymerization, which led to the formation of combustible volatiles and higher moisture levels, thus various exothermic reactions started to take place. During this process, the devolatilization of biomass components, in addition to the existence of excess air, triggered some exothermic reactions. Char oxidation occurred during the fifth zone of the combustion decomposition curves (400 to 600 °C). This is very clear from the sinusoidal shape of the TG curves and the clear peak of the DTG curves in this zone. Raw and carbonized cottonwood clones S7C20, ST66, and switchgrass show two clear oxidation peaks at 340 to 360 °C and  460 °C. The first peak denotes hemicellulose-cellulose oxidation, whereas the second peak is associated with biochar oxidation. The sixth zone ( 600 °C), ash production, is categorized by the slow weight reduction caused by the decomposition of lignin. Lignin structure can be represented by [C9H10O3(OCH3)0.9-1.7]n, indicating that the O/C ratio is low (0.43 to 0.52) (Chen and Kuo 2011). Lignin is comprised of three kinds of benzene-propane. Its heavily cross-linked structures are responsible for its high thermal stability compared with hemicellulose and cellulose. The devolatilization of insignificant amounts of volatiles in this zone leaves only ash as the remaining product. Because of the clear peak in the fifth zone (char oxidation zone), the values of the peak decomposition and the maximum decomposition temperatures were discussed separately, as shown in the following sections.
Tables 2 and 3 show the values of the peak decomposition derivative and the peak decomposition temperatures, respectively, for raw and carbonized cottonwood clones S7C20, ST66, and switchgrass in an air environment. The thermal decomposition peaks of raw and carbonized feedstock under combustion conditions were higher than their corresponding values under char oxidation conditions.
Doubling the heating rate during the biomass combustion decomposition in the air environment zone and in the char oxidation zone decreased the peak decomposition for the three raw and carbonized feedstocks, with only two exceptions (raw cottonwood clone ST66 and switchgrass at 40 °C/min). The highest peak decomposition rate (1.029%/°C) was observed during the combustion decomposition of raw cottonwood S7C20 at 10 oC/min. Conversely, the lowest peak decomposition rate (0.755%/°C) was found during the pyrolysis of raw cottonwood ST66 at 20 °C/min. Remarkable trends were observed during the combustion decomposition of raw and carbonized biomass in an air environment. The values of the peak decomposition derivative of the raw biomass were consistently higher than the corresponding values of the carbonized biomass under hemicellulose-cellulose decomposition. Carbonization of S7C20 and ST66 and switchgrass decreased the peak decomposition by 76.7%, 86.3%, and 22.3%, respectively, at a heating rate of 40 °C/min in this zone. Conversely, the values of the peak decomposition derivative of the raw biomass were consistently lower than the corresponding values of the carbonized biomass under the char oxidation environment. The lowest decomposition peak in the char oxidation stage among the three studied carbonized feedstocks (0.283%/°C) was observed with switchgrass at a heating rate of 40 °C/min. On the other hand, carbonized ST66 showed the highest decomposition peak derivative of 0.865 %/°C at a heating rate of 10 °C/min under the char oxidation condition.
Increasing the heating rate increased the peak decomposition temperature for the three studied raw feedstocks (S7C20, ST66, and switchgrass) under the combustion condition and the char oxidation state. In this study, the maximum decomposition temperatures ranged between 345.9 °C and 360.1 °C, 340.0 °C and 359.1 °C, and 341.0 °C and 354.0 °C for S7C20, ST66, and switchgrass, respectively, under the combustion condition. As was expected, the values of the maximum decomposition temperatures in the char oxidation zone were consistently higher than the corresponding values in the hemicellulose-cellulose decomposition zone for the raw and carbonized feedstocks. During the combustion decomposition of the carbonized feedstocks, increasing the heating rate from 10 °C/min to 40 °C/min did not show a clear correlation with the maximum decomposition temperature. Carbonization of the three studied feedstocks; i.e., S7C20, ST66, and switchgrass, showed increasing trends of the peak decomposition temperature, with increasing heating rates during the char oxidation zone. Maximum decomposition temperatures of 576.3 °C, 590.7 °C, and 494.5 °C were observed for S7C20, ST66, and switchgrass, respectively, under a heating rate of 40 °C/min.
Biomass weight losses corresponding to the maximum decomposition temperatures
During pyrolysis decomposition, combustion decomposition, and char oxidation, increasing the heating rate decreased the weight loss from the raw and carbonized feedstocks (Table 4). The maximum devolatilized weight (56.2%) was observed during the pyrolysis decomposition of raw ST66 at a heating rate of 10 °C/min, whereas the minimum decomposed weight (47.2%) was observed with raw ST66 at a heating rate of 40 °C/min. The decomposed weight losses observed in all carbonized feedstocks were lower than the corresponding weight losses observed in the raw materials. These results confirm the previous observation that carbonized biomass lacks cellulose and hemicellulose compounds. As mentioned earlier, lignin is thermally stable, so its devolatilization requires higher temperatures and longer residence times.
Table 4. Pyrolysis, Combustion, and Char Oxidation Weight Loss Corresponding to Peak Decomposition Rate (%) in Raw and Carbonized Cottonwood Clones and Switchgrass

During the combustion zone, biomass decomposed weights ranged between 52.5% and 45.9%; 51.1% and 46.7%; and 51.1 and 45.6% for S7C20, ST66, and switchgrass, respectively. It is clear that the weight loss in this zone was less than the corresponding weight loss during pyrolysis decomposition. This is because the peak decomposition temperatures during the pyrolysis zone were consistently higher than the peak decomposition temperatures during the combustion zones. The biomass weight loss ranges increased to 90.4% to 84.8%, 90.2 to 86.9%, and 86.9% to 81.7% for S7C20, ST66, and switchgrass, respectively, when the biomass temperature reached the char oxidation zone. Similarly, the weight loss values from the carbonized feedstock were lower than the corresponding values from the raw biomass in the char oxidation zone.
Activation energies and pre-exponential factors
The peak decomposition temperature and heating rates values were used to determine the essential values required for thermochemical technologies. These values included the pre-exponential value, A, and the activation energy, E, represented in Eq. 1. The activation energy values of raw cottonwood S7C20, ST66, and switchgrass in a nitrogen environment reached 260.1, 300.3, and, 234.5 kJ/mol, respectively, as shown in Table 5 (r2=0.902 to 0.935). Carbonization of S7C20, ST66, and switchgrass increased their activation energy values by 17.2%, 6.6%, and 41.5%, respectively, under the pyrolysis condition. This difference in the activation energies of raw biomass is caused by the various degrees of devolatilization of hemicellulose in the carbonized feedstocks. As a comparison, the activation energy of raw cottonwood S7C20, ST66, and switchgrass in an air environment reached 250.2, 235.3, and 306.0 kJ/mol, respectively, as shown in Table 5 (r2= 0.923 to 0.999). The activation energy values of carbonized biomass were lower than that of raw biomass by 2.8% (S7C20), 40.0% (ST66), and 21.6% (switchgrass) under combustion conditions. This phenomenon contrasts with the observations for pyrolysis. This is because of the higher energy density value in the carbonized feedstock as compared with the raw material. Excess air and a suitable environment triggers exothermic reactions and reduces the activation energy. Similarly, the activation energy values of carbonized biomass were lower than that of raw biomass during the oxidation zone. During the char oxidation zone, the activation energy of carbonized S7C20, ST66, and switchgrass decreased by 10.6%, 21.6%, and 2.2%, respectively, as compared with the activation energies of the raw feedstocks. Gašparovič et al. (2009) reported activation energy values in a slightly lower range for wood chips.
Table 5. Kinetics of Raw and Carbonized Cottonwood Clones and Switchgrass in a Nitrogen Environment

The pre-exponential values of the raw feedstocks ranged between 2.26 x 10¹³ and 3.94 x 10¹⁸ under pyrolysis and between 7.74 x 10¹³ and 1.05 x 10²⁰ under combustion. On the other hand, the pre-exponential values of the carbonized feedstocks ranged between 9.44 x 10¹⁸ and 3.93 x 10²¹ under pyrolysis and between 6.25 x 1005 and 3.58 x 10¹⁴ under combustion. The pre-exponential values of carbonized feedstocks were noticeably higher than the pre-exponential values of raw feedstocks under pyrolysis conditions. Conversely, the pre-exponential values of carbonized feedstocks were lower than that of raw feedstocks under combustion conditions and in the char oxidation zone for the three studied feedstocks.
Implications of Results
The nature and chemical composition of raw biomass can lead to significant increases in infrastructure costs or reactor problems if co-firing is conducted with high ratios of biomass to coal. Ameliorating raw biomass physiochemical properties and concentrating its energy density could increase acceptance of biomass for co-firing operations.

Fig. 2. Sample weights and weight loss derivatives of raw cottonwood clones S7C20, ST66, and switchgrass as a function of temperature in a nitrogen environment

Fig. 3. Sample weights and weight loss derivatives of carbonized cottonwood clones S7C20, ST66, and switchgrass as a function of temperature in a nitrogen environment

Fig. 4. Sample weights and weight loss derivatives of raw cottonwood clones S7C20, ST66, and switchgrass as a function of temperature in an air environment

Fig. 5. Sample weights and weight loss derivatives of carbonized cottonwood clones S7C20, ST66, and switchgrass as a function of temperature in an air environment
The finding from the present study inspired the use of a continuous system to produce biochar. Accordingly, an auger thermochemical system was designed and constructed in the bioenergy laboratory at the Rice Research and Extension Center (Stuttgart, AR). The reactor is an externally heated reactor that uses augers to move the feedstock through the reactor. The reactor has three-zone electrical heater to heat the reactor. This system is capable of continuously producing charcoal from agricultural residues.
CONCLUSIONS
- Carbonization significantly reduced the volatile solids contents of S7C20, ST66, and switchgrass to 35.5%, 25.3%, and 25.9%, respectively. Furthermore, it decreased their bulk densities by 20.3%, 31.7%, and 19.8%.
- The average heating values of S7C20, ST66, and switchgrass increased from 17.6 to 28.0 MJ/kg, from 18.0 to 28.8 MJ/kg, and from 16.2 to 27.4 MJ/kg, respectively, when treated via the carbonization process.
- The DTG pyrolysis curves showed six distinctive zones (drying, heating, torrefaction, carbonization, active pyrolysis, and passive pyrolysis) over a temperature range of 30 to 800 °C. Similarly, the DTG combustion curves showed six distinctive zones (drying, heating, hemicellulose, cellulose devolatilization, char oxidation, and ash production) over the same temperature range.
- Biomass decomposed weight ranged between 49.7% and 54.9%, 47.2% and 56.2%, and 49.5 and 52.2% for S7C20, ST66, and switchgrass, respectively, under pyrolysis conditions, whereas the biomass decomposed weight ranged between 45.9% and 52.5%; 46.7% and 51.1%; and 45.6 and 51.1% for the same feedstocks under the combustion condition.
- Carbonization increased activation energies values by 6.6 to 41.5% under pyrolysis conditions, and decreased them by 2.2 to 21.6% under combustion conditions.
- The carbonization technique used in this research successfully produced an artificial charcoal from agroforestry products.
ACKNOWLEDGMENTS
The authors acknowledge the financial support provided by the USDA Agriculture and Food Research Initiative of the National Institute of Food and Agriculture, Grant No. 2011-67010-20078.
REFERENCES CITED
Balat, M., Balat, H., and Öz, C. (2008). “Progress in bioethanol processing,” Progress in Energy and Combustion Science 34(5), 551-573. DOI: 10.1016/j.pecs.2007.11.001
Bergman, P. C. A. (2005). “Combined torrefaction and pelletisation, the TOP process,” ECN-C-05-073 Project Report, Energy Research Centre of the Netherlands, (http://www.ecn.nl/docs/library/report/2005/c05073.pdf).
Bergman, P. C. A., and Kiel, J. H. A. (2005). “Torrefaction for biomass upgrading,” in: Proceedings of the 14th European Biomass Conference & Exhibition, Paris, France, October 17-21, 2005.
Bergman, P. C. A., Boersma, A. R., Zwart, R. W. R., and Kiel, J. H. A. (2005). “Torrefaction for biomass co-firing in existing coal-fired power stations ‘BIOCOAL’,” ECN-C-05-013 Project Report, Energy Research Centre of the Netherlands, (http://www.ecn.nl/docs/library/report/2005/c05013.pdf).
Byrne, C. E., and Nagle, D. C. (1997). “Carbonization of wood for advanced materials applications,” Carbon 35, 259-266. DOI: 10.1016/S0008-6223(96)00136-4
Chen, W. H., and Kuo, P. (2011). “Torrefaction and co-torrefaction characterization of hemicellulose, cellulose and lignin as well as torrefaction of some basic constituents in biomass,” Energy 36(2), 803-811. DOI: 10.1016/j.energy.2010.12.036
Demirbas, A. (2005). “Estimating of structural composition of wood and non-wood biomass samples,” Energy Sources 27, 761-767.
Gašparovič, L., Koreňová, Z., and Jelemenský, L. (2009). “Kinetic study of wood chips decomposition by TGA,” 36th International Conference of SSCHE, May 25–29, 2009, Tatranske Matliare, Slovakia.
Kissinger, H. (1956). “Variation of peak temperature with heating rate in differential thermal analysis,” Journal of Research of the National Bureau of Standards 57(4), 217-221. DOI: 10.6028/jres.057.026
Liechty, H., Blazier, M., Pelkki, M., White Jr., D., and Robinson, Z. (2012). “The potential for using agroforests for bioenergy production in the Lower Mississippi Alluvial Valley,” In: Proceedings of IUFRO 3.08.00 Small Scale Forestry Conference 2012: Science for Solutions (ed. S. R. Meyer), September 24–27, Amherst, MA, pp. 88-92.
Lipinsky, E. S., Arcate, J. R., and Reed, T. B. (2002). “Enhanced wood fuels via torrefaction,” Fuel Chemistry Division Preprints 47(1), 408-410.
Maiti, S., Dey, S., Purakayastha, S., and Ghosh, B. (2006). “Physical and thermochemical characterization of rice husk char as a potential biomass energy source,” Bioresource Technology 97, 2065-2070. DOI: 10.1016/j.biortech.2005.10.005
Malghani, S., Gleixner, G., and Trumbore, S. E. (2013). “Chars produced by slow pyrolysis and hydrothermal carbonization vary in carbon sequestration potential and greenhouse gases emissions,” Soil Biology & Biochemistry 62, 137-146. DOI: 10.1016/j.soilbio.2013.03.013
Phanphanich, M., and Mani, S. (2011). “Impact of torrefaction on the grindability and fuel characteristics of forest biomass,” Bioresource Technology 102(2), 1246-1253. DOI: 10.1016/j.biortech.2010.08.028
Prins, M., Krzysztof, P., and Frans, J. (2006). “Torrefaction of woods, Part 2: Analysis of products,” Journal of Analytical and Applied Pyrolysis 77, 35-40. DOI: 10.1016/j.jaap.2006.01.001
Sadaka, S., and Negi, S. (2009). “Improvements of biomass physical and thermochemical characteristics via torrefaction process,” Environmental Progress & Sustainable Energy 28(3), 427-434. DOI: 10.1002/ep.10392
Sadaka, S. S. (2013). “Gasification of raw and torrefied cotton gin wastes in an auger system,” Applied Engineering in Agriculture 29(3), 405-414.
Sadaka, S., Sharara, M., Ashworth, A., Keysser, P., Allen, F., and Wright, A. (2014). “Characterization of biochar from switchgrass carbonization,” Energies 7(2), 548-567. DOI: 10.3390/en7020548
Tripp, S., Powell, S. R., and Nelson, P. (2009). “Regional strategy for biobased products in the Mississippi Delta,” prepared for: The 98 Counties in the Mid‐South Mississippi Delta Region Located in Arkansas, Kentucky, Missouri, Mississippi, and Tennessee, Battelle Technology Partnership Practice, Agbioworks, (http://www.agbioworks.org/downloads/FullReport.pdf. Accessed 6/21/2014).
USEPA, United States Environmental Protection Agency. (June, 2014). “Overview of the clean power plan. Cutting carbon pollution from power plants,” EPA Fact Sheet: Clean Power Plan, (http://www2.epa.gov/sites/production/files/2014-05/documents/20140602fs-overview.pdf).
Van Krevelen, D. W. (1993). Coal: Typology, Physics, Chemistry, Constitution, 3rd Ed., Elsevier, Amsterdam.
Yang, H. P., Yan, R., Chen, H. P., Lee, D. H., and Zheng, C. G. (2007). “Characteristics of hemicellulose, cellulose and lignin pyrolysis,” Fuel 86(12-13), 1781-1788. DOI: 10.1016/j.fuel.2006.12.013
Zheng, A. Q., Zhao, Z. L., Chang, S., Huang, Z., He, F., and Li, H. B. (2012). “Effect of torrefaction temperature on product distribution from two-staged pyrolysis of biomass,” Energy & Fuels 26(5), 2968-2974. DOI: 10.1021/ef201872y
Article submitted: February 9, 2015; Peer review completed: May 12, 2015; Revised version received and accepted: May 22, 2015; Published: June 2, 2015.
DOI: 10.15376/biores.10.3.4498-4518