Abstract
Softness, as a subjective perception, is difficult to define and quantify. For decades, panel tests have been used to judge differences in the softness of hygiene tissue samples. Panel tests can be a time-consuming and expensive process. A number of protocols have been developed to quantify the physical properties of tissues associated with softness. The Tissue Softness Analyzer (TSA) by Emtec has gained popularity in characterizing the physical properties of tissues associated with softness. The instrument was designed with softness in mind and attempts to simulate the touch of the human hand. There is currently no comprehensive study that compares the results from a TSA and human panel. In this work, panel tests were used to validate the performance of the TSA with bath tissue. It was determined that one component of the TSA measurements (TS7) linearly correlated with the panel results. Among all of the algorithms available for use with the TSA, the TP2 algorithm most accurately predicted the panel scores. The TSA performed better in predicting the softness of the samples that were dried with a conventional wet press or creped-through air-dryer.
Download PDF
Full Article
Relationship between Human Perception of Softness and Instrument Measurements
Yuhan Wang,a Tiago De Assis,a Franklin Zambrano,a Lokendra Pal,a Richard Venditti,a Sudipta Dasmohapatra,b Joel Pawlak,a,* and Ronalds Gonzalez a,*
Softness, as a subjective perception, is difficult to define and quantify. For decades, panel tests have been used to judge differences in the softness of hygiene tissue samples. Panel tests can be a time-consuming and expensive process. A number of protocols have been developed to quantify the physical properties of tissues associated with softness. The Tissue Softness Analyzer (TSA) by Emtec has gained popularity in characterizing the physical properties of tissues associated with softness. The instrument was designed with softness in mind and attempts to simulate the touch of the human hand. There is currently no comprehensive study that compares the results from a TSA and human panel. In this work, panel tests were used to validate the performance of the TSA with bath tissue. It was determined that one component of the TSA measurements (TS7) linearly correlated with the panel results. Among all of the algorithms available for use with the TSA, the TP2 algorithm most accurately predicted the panel scores. The TSA performed better in predicting the softness of the samples that were dried with a conventional wet press or creped-through air-dryer.
Keywords: Formation; Tissue softness analyzer; Softness; Bath tissue; TS7; Panel test
Contact information: a: Department of Forest Biomaterials, North Carolina State University, P. O. Box 8005, Raleigh, NC 27695-8005, USA; b: Department of Statistical Science, Duke University P. O. Box 90251, Durham, NC 2770, USA; *Corresponding authors: joel_pawlak@ncsu.edu; rwgonzal@ncsu.edu
INTRODUCTION
Softness can be defined as the human perception of a texture that is velvety, delicate, and bulky (Hollmark and Ampulski 2004; De Assis et al. 2018). This feeling varies from person to person and region to region. It is related to the tactile, visual, auditory, and olfactory senses and perceptions (Leporte 1970). The human brain processes all of these factors and evaluates the feeling of softness (Gallay 1976). Such complexity makes softness difficult to measure and quantify. Previous studies have indicated that among all of the senses, the tactile properties are the most determinant for evaluation of the softness (Gallay 1976).
Softness is one of the most important properties of hygiene tissue (De Assis et al. 2018). Hygiene tissues include kitchen towels, facial tissues, and bath tissues. For tissue paper, softness may be parsed into surface softness and bulk softness (Gallay 1976; Hollmark and Ampulski 2004). Surface softness is perceived by gently rubbing the fingertips and palms over the tissue surface (Leporte 1970). It is generally believed that surface softness is mainly affected by the surface friction coefficient and free fiber stiffness (Hollmark and Ampulski 2004). Lamellar corpuscles (Biswas et al. 2015), tactile corpuscles (Paré et al. 2001), and Merkel cells (Mescher 2013) are the three most important anatomical features of the hand that evaluate surface softness. When a human hand wipes across the surface of a bath tissue, the lamellar corpuscle on the fingertips interacts with every free fiber that sticks out from the surface of the tissue and generates vibrations, with an optimal sensitivity at 250 Hz (Biswas et al. 2015). The tactile corpuscle on the hand responds to vibrations between 10 Hz and 50 Hz, which typically correlate with the surface texture vibration as a hand wipes across a surface (Paré et al. 2001). The Merkel cells on the fingertips receive the pressure generated by the light touch of the web surface, which is related to the local web stiffness (Mescher 2013). Over 17000 mechanoreceptive units on a human hand generate electric signals that are transmitted to the brain for processing (Biswas et al. 2015). Alternatively, it is believed that surface softness is solely related to surface friction. Free fiber ends reduce the contact area between a hand and tissue web, which results in increased softness. Bulk softness is the perception generated by the light folding and crumpling of a tissue. Bulk softness is mainly related to the overall compressibility and stiffness (Leporte 1970; Hollmark and Ampulski 2004). Although softness itself is subjective and difficult to quantify, its related properties, such as fiber stiffness, surface roughness, and compressibility, have been well-studied and can be manipulated to increase the overall softness of tissue samples.
When a human hand touches the surface of a tissue, a series of pressing and deflective forces are applied to every single fiber. Each of these forces generates an impulse to the human brain; higher impulses reflect a local surface that is less soft (Leporte 1970). Both deflection and pressing are related to fiber stiffness. As the fiber stiffness increases, the deflection and pressing of a fiber becomes more difficult (Pawlak and Keller 2004). Therefore, fiber selection is a key factor in increasing the surface softness. Tissue products are mainly manufactured with a mix of softwood and hardwood fibers (De Assis et al. 2018). Because hardwoods have a thinner cell wall and lower fiber modulus than softwoods, hardwoods have been used as the major component of hygiene tissue products. Softwood is used to increase the strength of the tissue web (De Assis et al. 2018). For bath tissue, the ratio of hardwood to softwood is typically 7 to 3 (FisherSolve International 2017). This ratio changes based on the product grades, fiber availability, and cost. Because of economic and sustainability factors, recycled fibers have also been used as a major fiber source for bath tissue. Recycled fibers become shorter and stiffer during each repulping process, which ultimately affects the quality of the final product (De Assis et al. 2018).
To make a less dense tissue web, bath tissue manufacturers use heat and forced air to remove most of the moisture, instead of using high levels of wet pressing (Hollmark and Ampulski 2004). To further increase the tissue bulk, a through-air dryer (TAD), which pushes hot dry air through the tissue sheet, is used in some premium- and ultra-grade bath tissues that have greater web porosity than standard-grade tissues (De Assis et al. 2018). To increase the number of free fiber ends and decrease the local stiffness, a creping blade is used to scrape the surface of the dry web. The creping process alters the web structure and creates more free fibers (Kullander et al. 2012). The combination of TAD and creping is also called creped-through air-drying (CTAD) and is typically used for producing the softest tissue grades (Sanford and Sisson 1967). Uncreped-through-air-drying (UCTAD) skips the process of creping and uses only air to dry the tissue.
Though properties related to softness are well studied, measuring softness itself is challenging. The most widely accepted method is the panel test (Institute of Paper Chemistry 1967). The panel test includes scoring and ranking methods. For the scoring method, panelists are asked to grade the softness of sample tissues on a certain scale. References (tissue samples) are given at the beginning of the evaluation with fixed scores, and the participants grade the samples against the references provided. For the ranking method, panelists are asked to rank the samples from least to most soft by a pair-wise comparison. No references are necessary for the ranking method. However, it is a tedious test to perform for large sample sizes and the ranking method may hide differences in the softness between samples (Hollmark and Ampulski 2004). Alternatively, the scoring method quantifies the softness, but panelists have difficulties in assigning scores with few references. However, introducing more references in the scoring method increases bias during measurement (Hollmark and Ampulski 2004).
Additional efforts for measuring softness can be categorized in instrumental and algorithm methods.
The instrumental methods include:
1. The Handle-O-Meter measures the softness by pushing a tissue sample into a hole with increasing weight (Lashof 1960). The results from the Handle-O-Meter have been found to be consistent with repeated measurements, but do not correlate well with panel test results (Lashof 1960). The test method was accepted by TAPPI in 1985 and removed in 1996.
2. The Kawabata device was the first widespread instrument for measuring tissue softness (Kawabata 2002). The instrument measures three major parameters: the coefficient of friction, mean deviation of the coefficient of friction, and geometrical roughness (Hollmark and Ampulski 2004). The device was found to be able to distinguish between the softness of kitchen towels, but is inaccurate for softer bath tissues (Hollmark and Ampulski 2004).
The algorithm methods include:
1.Pan et al. (1989) introduced an algorithm that uses an ultrasonic test, caliper, and basis weight. A multiple regression analysis was performed using the panel test results as the response. The results showed that the ultrasonic test highly correlated with the panel test. However, the sample size was only seven with 2-ply samples that were split, which limits the function of this algorithm.
2. Kuo and Cheng (2000) measured the surface friction, creping ratio, and creping blade service time of tissue samples and compared these parameters with softness panel results. It was found that the softness increased as the creping ratio and service time decreased.
3. Furman and Gomez (2007) used a scanning laser microscope to analyze the relationship between a topographical surface property of tissue and the softness. It was found that the projected surface area ratio correlated well with the panel results (R2 = 0.9183). However, there were only six samples with large differences in the softness tested and the procedure for measuring the projected surface area ratio is complicated.
4. Ko et al. (2017) invented a novel algorithm to calculate softness by measuring tensile stiffness, surface roughness, surface friction. This method successfully separated surface and bulk softness.
All of these measurements have some limitations and lose accuracy in certain circumstances, such as with different fiber types, orientations, and moisture contents (Hollmark and Ampulski 2004). Though researchers have used many different methods to measure softness, the goal remains to find quantifiable properties that relate to softness. These methods provide good correlations for their results, but most of them have not been widely accepted because of the lack of pervasiveness, high costs, time-consuming procedures, and small calibration ranges (Ramasubramanian 2002).
To create a reliable and reproducible test device, Giselher (2012) invented the Tissue Softness Analyzer (TSA). Emtec claimed that the TSA was manufactured to mimic the perception of softness of the human hand. This instrument measures the softness of paper by spinning a lamellar fan on the surface of the sample. The lamellae of the fan touch the free fibers of the sample, record the roughness of the surface, and measure the overall stiffness of the sample. The TSA measures three basic parameters: TS7 (real softness), TS750 (surface smoothness), and D (stiffness) (Giselher 2012). The sensor receives a sound response from a vibration and produces a sound spectrum. Two peaks are generated that correspond to the TS750 and TS7. The TS7 peak measures the response from the vibrations caused by the lamellae. The amplitude of the response mainly depends on the fiber stiffness and orientation on the surface. If the lamellae cross a thick and stiff fiber, it produces a higher intensity peak. A lower peak is produced if the lamellae cross a thin and flexible fiber. When the TS7 peak response is higher, the tissue is less soft. The TS750 peak corresponds to the vibration of the tissue membrane. Such vibrations are mainly caused by roughness and embossing (Furman and Gomez 2007). When the peak response is higher, the tissue surface is less smooth. The fan also presses the paper web to measure the stiffness of the sheet. The instrument uses these three parameters, along with the basis weight and caliper, as predictors and uses panel test results as a response to generate a series of complex algorithms called TP1, TP2, TP3, TP4, TP5, and TP6. The TP1, TP2, and TP3 algorithms were designed for populations in the USA, Near East, and Asia. The TP4, TP5, and TP6 algorithms were designed for populations in Europe, South America, and Canada. Using these algorithms, the TSA provides a handfeel (HF) coefficient for each sample, with a higher HF value corresponding to a higher softness (Giselher 2012).
The TSA is used by bath tissue manufacturers, but there is currently no comprehensive study in the literature that compares the results of a TSA and human panel. The goal was to determine if the TSA provides a good assessment of the softness of bath tissue relative to a panel. In this research, panel tests were performed and the results were compared with the TSA results. A potentially more reliable algorithm was proposed to correspond to the panel results of this study.
EXPERIMENTAL
Bath Tissue Samples
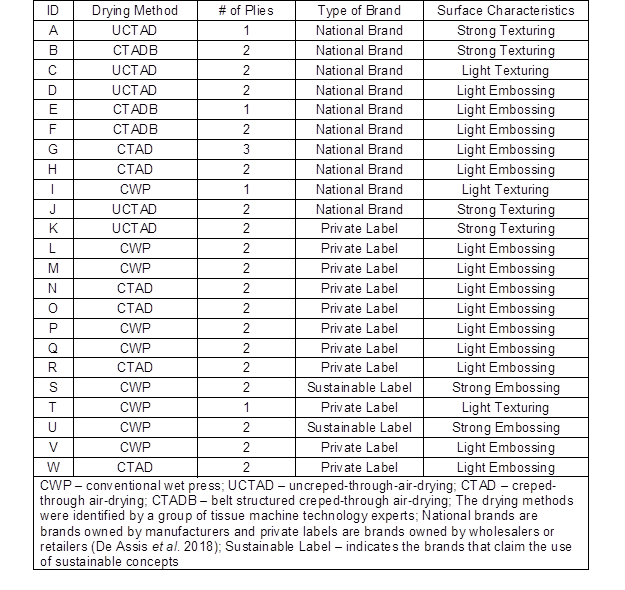
Twenty-three bath tissue products were sourced across the USA and evaluated in this research. All major consumer brands and the majority of private label brands were included in this study, which represented more than 80% of the total consumer market for bath tissue in the USA. The samples were purchased in different stores across the USA. Table 1 describes each sample, including the market segment, number of plies, paper machine technology, and surface characteristics. The tissue machine technology was determined by tissue machine specialists (De Assis et al. 2018).
Physical Properties
All of the bath tissue and handsheet samples were conditioned in a room maintained at 50% relative humidity and 23 °C (TAPPI T 402 sp-08 2013). The basis weight, which is defined as the mass of paper per unit surface area, was measured according to TAPPI T 410 om-08 (2013). The caliper was also measured in accordance with TAPPI T 411 om-97 (1997).
Table 1. Summary of the Properties of the Commercial Samples
Tissue Softness Analyzer Measurement
The surface softness, surface smoothness, and stiffness were measured using a TSA manufactured by Emtec (Leipzig, Germany). A 10-cm × 10-cm bath tissue sample was placed and clamped into the holder of the TSA. A fan with six lamellae moved vertically downward to touch the surface of the sample web. The fan started to rotate on the surface of the sample, which caused vibrations. A sound sensor captured the sound generated by these vibrations. Two peaks with different sound frequencies were generated from this measurement. The first peak at 200 Hz to 2000 Hz was related to the surface smoothness (TS750), which is affected by creping, embossing, texturing, and surface finishing. The second peak at 6500 Hz (TS7) corresponded to a higher vibration and is mainly related to the vibration of free fiber ends on the surface. Specifically, a vertical force ranging from 0.1 N to 0.6 N was applied to the sample, the resulting displacement was measured, and the stiffness of the sample was calculated as the ratio of displacement to the vertical force. The instrument used a complex algorithm based on the TS7, TS750, web stiffness, basis weight, and caliper to calculate an HF score with results ranging from 0 (least soft) to 100 (softest).
Panel Test
Panelist screening
Before the test, the panelists conditioned their hands by washing with mild soap and applying hand lotion. As a standard procedure, each panelist had to be in good health without any callouses, circulation disorders, or dry or chapped skin on their hands (Civille and Dus 1990). The participants of the panel were graduate students, five of whom were from Asia, five from South America, and three from North America.
One reference panel test method
Twenty-four samples were given to the 13 participants to do a ranking test to first determine the least soft sample. The sample categorized as least soft was set as the reference with a score of 50. The participants were then asked to give a softness score (from 50 to 100) to the rest of the samples by looking at the appearances of the samples, touching and wiping the outer and inner plies, and by crumpling the tissues.
Three references panel test method
The 13 participants were first asked to do a small ranking test with nine samples. The nine samples included ultra, premium, and economy samples. The participants were asked to rank these samples from 1 (least soft) to 9 (softest). The modes were calculated for ranks 1, 5, and 9. These three modes were used as the references and reassigned the values 50, 75, and 100, respectively. The participants were then asked to give a softness score for the rest of the 21 samples from 50 to 100 by comparing them against these three references, following the same protocol of the one reference panel test.
Multiple linear regression
Multiple linear regression was performed using software R () to determine which parameters (TS7, TS750, basis weight, caliper, and stiffness) were related to the panel test results.
RESULTS AND DISCUSSION
TSA Parameter Analysis
Figure 1 shows that the only important TSA parameter that was related to the one reference panel test method score was TS7, which had a clear and linear downward trend with an R2 of 0.68. As shown in Table S1, the result of TS7 has a low standard deviation which indicated the consistency of the measurement. The TSA graded the private label samples more accurately than the brand label samples for the TS7 (R2 = 0.88). This was likely because some brand label samples had a more complex finish composition (FisherSolve International 2017) and some of them had additional processing steps, such as strong embossing and spraying lotion. The five samples circled in Fig. 1 used UCTAD as well. There were no relationships found between the panel scores and the TS750 or stiffness. There was a proportional relationship that was somewhat weak between the panel score and the basis weight and caliper. This indicated that either customer prefer bath tissue that is heavier and thicker or that higher softness products also tended to be heavier and thicker.
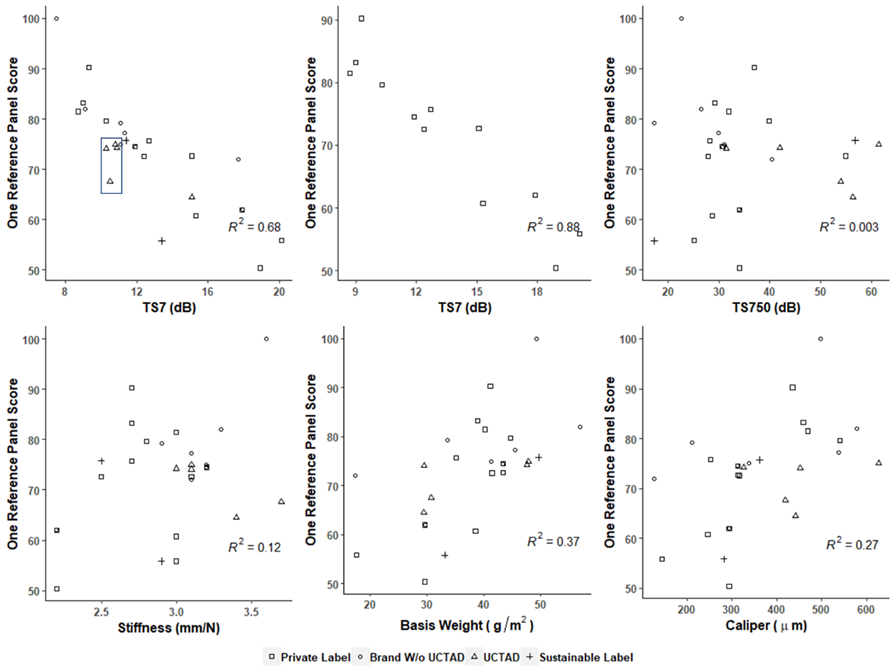
Fig. 1. Linear plots of the one reference panel method vs. TSA parameters
Figure 2 shows that the panel test performed with three references showed a slightly stronger linear correlation between the panel scores and TS7 values. The R2 for TS7 increased from 0.68 for the one reference panel test method to 0.72 for the three references panel test method, which might have indicated that the panelists were able to assign scores to the samples more accurately. Brand label samples with a TS7 value of approximately 12 exhibited a smaller rating range compared with the one reference panel method score. There was probably some correlation between the caliper and panel score, but the scatter in the data was large. Neither the TS750 nor stiffness played a major role based on the panel test.
A similar relationship was found between the TS7 and three references panel scores for only the private label samples (R2 = 0.88). Though panelists had different genders and ethnicities, the panel score results for both one reference and three references were generally consistent (Tables S2 and S3). The three references panel test had a relatively lower variation due to the introduction of two more references (Table S3).
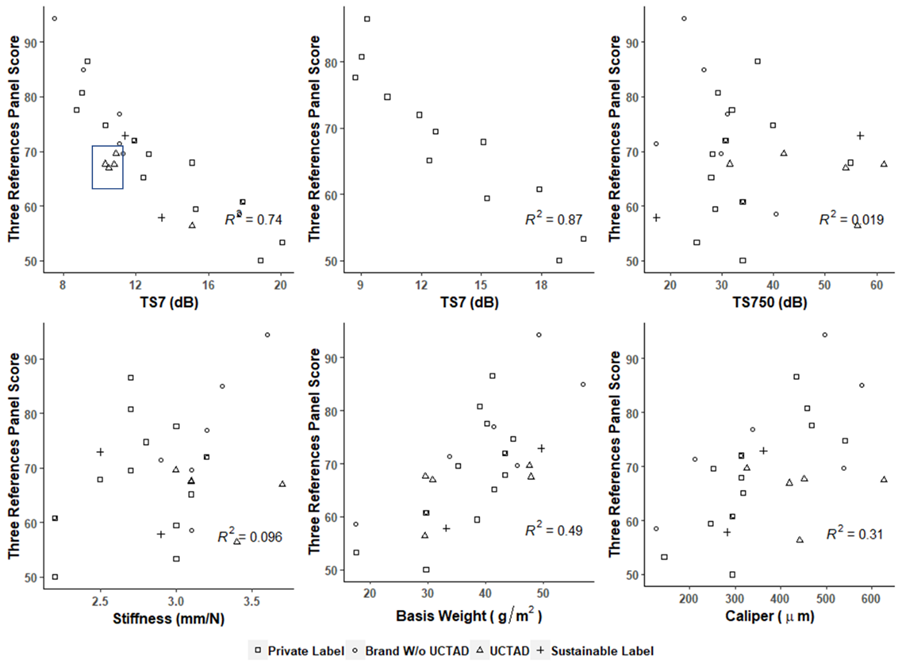
Fig. 2. Linear plots of the three references panel score vs. TSA parameters
TSA Algorithm Validation
There are six major algorithms used by the TSA to calculate the HF. These algorithms were generated for different consumer regions. Analysts can adjust their model by choosing a different algorithm to suit their target consumers (Giselher 2012). The plots of different algorithms against the three references panel test method score are shown in Fig. 3. The TP1, TP2, TP3, and TP5 algorithms were linearly correlated with the panel score results, and TP2 had the highest R2 value (0.68). No obvious linear correlation was seen for the TP4 and TP6 algorithms, which was probably because of the variations in the race and origin of the participants.
Figure 4 shows that the TP2 algorithm predicted the softness scores of the private label samples (R2 = 0.84) more accurately than it did for the brand samples (R2 = 0.63). This corresponded with the previous result of the TS7; the outliers for the TP2 validation and TS7 plot were identical. This indicated that the TSA performed better when analyzing products with creping and less embossing. The TSA was probably able to capture the contribution of the fiber selection to the softness but failed to include other factors, such as embossing, texturing, and uncertainty factors from UCTAD, into the algorithm. The TSA results corresponded well with the previous work by Theiulin and coworkers (2017). In their work, they stated that softness perception was a function of acoustic vibration and surface velvetiness. The TSA successfully captured the acoustic vibration of the fan from TS7. The velvetiness of the surface was mainly attributed from the free fibers on the surface (Thieulin et al. 2017). The free fibers are typically produced by the creping process (De Assis et al. 2018). The panelists were able to sense this velvetiness and input it as a function of softness. The TSA was not able to include this velvetiness into its measurement which caused the significant disagreement with the panel results on UCTAD samples.
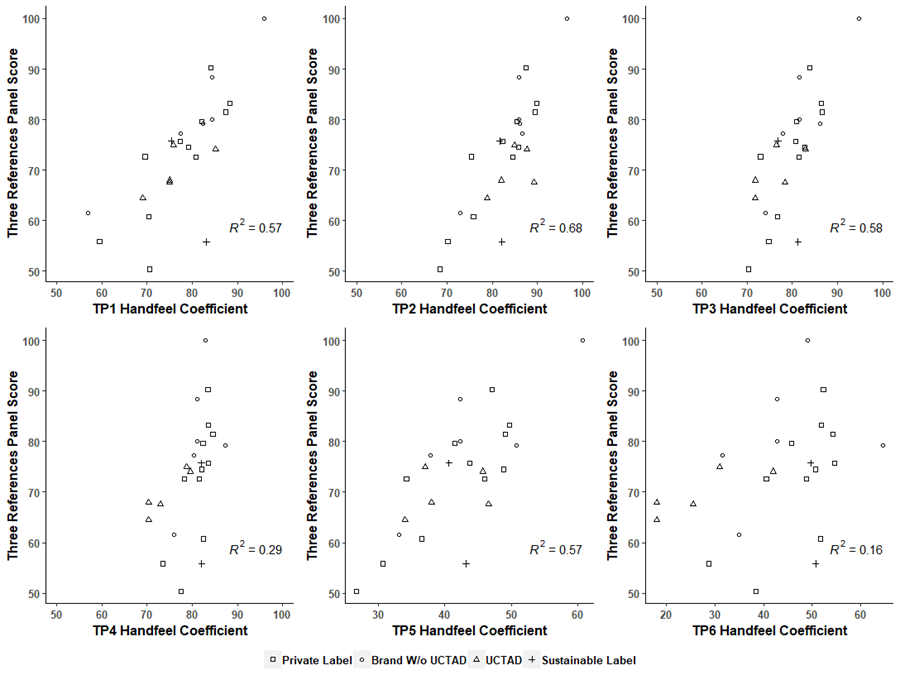
Fig. 3. Validation of the TSA algorithms using linear regression
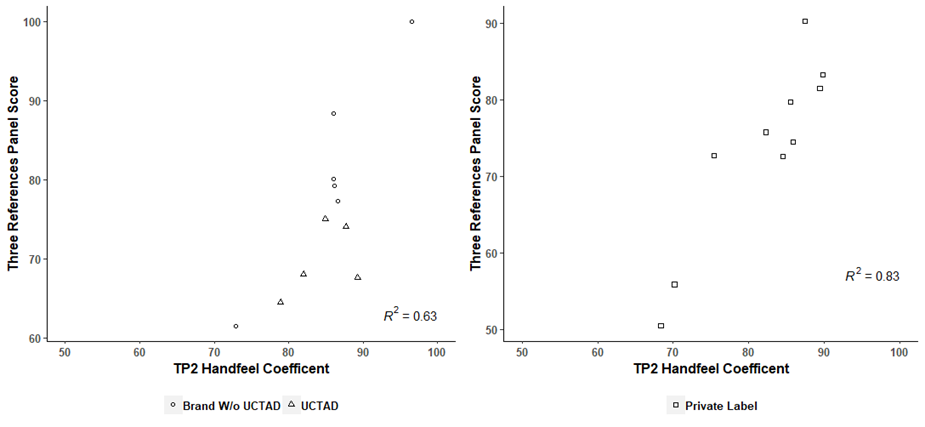
Fig. 4. Validation of the TP2 TSA algorithm using different panel results
Figure 5 shows that there was a strong linear correlation between the TP2 HF coefficient results and TS7, which confirmed that TS7 was the major contributor to the HF values for the TP2 algorithm (R2 = 0.92). No relationship was found between the TP2 HF and TS750 values (Fig. 5), which corresponded to the insufficiency of measuring the contribution of the macro-surface texture (texturing and embossing) to the softness. The samples dried by UCTAD seemed to be overvalued (TP2 graded the softness higher than was perceived by the panels) by the TSA due to the failure of capturing surface velvetiness (Thieulin et al. 2017). In general, there was a weak increasing trend in the HF with the basis weight and caliper. This overall correlation was weak due to the variation in processing. The basis weight and caliper are the properties that characterize the fibers bonding and packing structures. These two parameters were affected significantly when TAD and multi-layer processes applied to the samples. No obvious correlation was detected between the stiffness and TP2; this was probably because of the variation in the number of plies in the samples. Emtec claims that the HF correlation is a function of the TS7, TS750, stiffness, basis weight, and caliper (Giselher 2012), but their algorithm is proprietary. It is still unclear how the TS750 and stiffness contribute to the HF factor. There were also some collinearities between TS7, caliper and basis weight, which made the multiple regression less practical (Table S4). Among all of the algorithms, TP2 most strongly correlated with the TS7 (R2 = 0.92). Linear relationships were found between the TS7 and the TP1, TP2, TP3, and TP5 algorithms. No linear relationships were found between the TS7 and the TP4 and TP6 algorithms (Fig. 6).
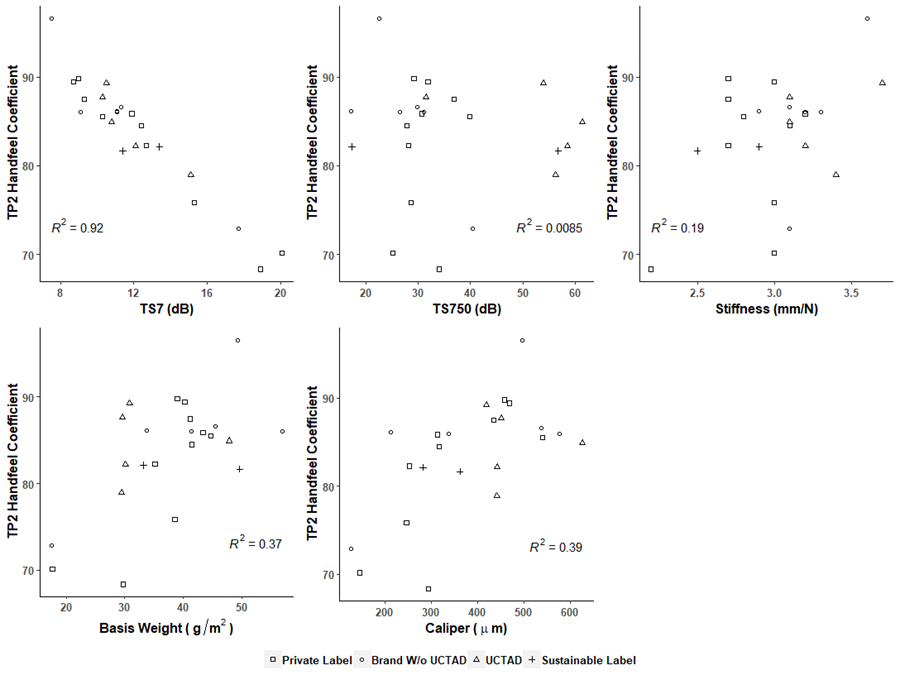
Fig. 5. Linear plots of the TP2 HF results vs. predictor parameters
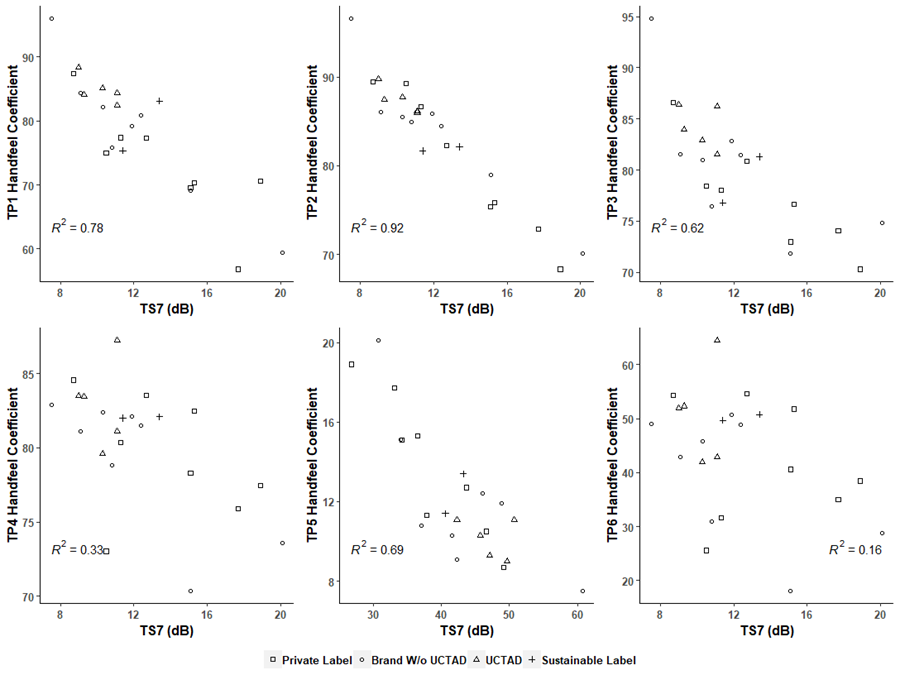
Fig. 6. Linear plots of the HF algorithms vs. TS7
CONCLUSIONS
A panel test was performed to validate the performance of the Emtec TSA. It was found that, among all of the parameters generated by the TSA, the TS7 parameter, which measures the surface softness, had the strongest linear correlation with the results of both the one and three references panel tests.
In general, as the basis weight and caliper increased, the HF increased, although there was notable scatter in the data.
The three references panel test method correlated to the TSA results slightly better than the one reference panel test method.
The TSA was found to perform well in predicting the softness of the samples with simple finishing but was less accurate when the test samples had strong embossing, texture, or were dried by UCTAD. This is probably due to that TSA is unable to capture the surface velvetiness and use it as a function at calculating HF coefficient.
The TP2 algorithm correlated most strongly with the panel results.
REFERENCES CITED
Biswas, A., Manivannan, M., and Srinivasan, M. A. (2015). “Vibrotactile sensitivity threshold: Nonlinear stochastic mechanotransduction model of the Pacinian corpuscle,” IEEE T. Haptics 8(1), 102-113. DOI: 10.1109/TOH.2014.2369422
Civille, G. V., and Dus, C. A. (1990). “Development of terminology to describe the handfeel properties of paper and fabrics,” J. Sens. Stud. 5(1), 19-32. DOI: 10.1111/j.1745-459X.1990.tb00479.x
De Assis, T., Reisinger, L. W., Pal, L., Pawlak, J., Jameel, H., and Gonzalez, R. W. (2018). “Understanding the effect of machine technology and cellulosic fibers on tissue properties – A review,” BioResources 13(2), 4593-4629. DOI: 10.15376/biores.13.2.4593-4629
FisherSolve International (2017). “FisherSolve database,” (https://www.fisheri.com/products-services/fishersolve/), Accessed 23 March 2018.
Furman, G., and Gomez, S. (2007). “Analysis of the surface softness of tissue paper using confocal laser scanning microscopy,” in: Proceedings of the Tissue World Conference, Nice, France.
Gallay, W. (1976). “Textural properties of paper: Measurements and fundamental relationships,” in: The Fundamental Properties of Paper Related to Its Uses, F. M. Bolam (ed.), British Paper and Board Industry Federation, London, UK.
Giselher, G. (2012). A New and Objective Measuring Technique to Analyze the Softness of Tissue Leaflet Collection (Emtec Tissue Softness Analyzer User Manual), Emtec, Radnor, PA.
Hollmark, H., and Ampulski, R. (2004). “Measurement of tissue paper softness: A literature review,” Nord. Pulp Pap. Res. J. 19(3), 345-353.
Institute of Paper Chemistry (1967). Softness of Sanitary Tissues, Evaluation by Industry Panels (Report 7, Project 2220), Institute of Paper Science and Technology, Atlanta, GA.
Kawabata, S. (2002). “Testing the tactile properties of tissue and nonwovens,” in: Handbook of Physical Testing of Paper: Volume 2, J. Borch, M. Lyne, R. Mark, and C. Habeger Jr. (eds.), CRC Press, Boca Raton, FL, pp. 505-530.
Ko, Y. C., Park, H. Y., Lee, J. H., and Kim, H. J. (2017). “Principles of developing a softness evaluation technology for hygiene paper,” J. of Korea Tappi 49(4), 184-193. DOI: 10.7584/JKTAPPI.2017.08.49.4.184
Kullander, J., Nilsson, L., and Barbier, C. (2012). “Evaluation of furnishes for tissue manufacturing; suction box dewatering and paper testing,” Nord. Pulp Pap. Res. J. 27(1), 143-150. DOI: 10.3183/NPPRJ-2012-27-01-p143-150
Kuo, L., and Cheng, Y. (2000). “Effects of creping conditions on surface softness of tissue paper: Application of sled method,” Tappi J. 83(12), 121.
Lashof, T. W. (1960). “Note on the performance of the Handle-O-Meter as a physical test instrument for measuring the softness of paper,” Tappi J. 43(5), 175A-178A.
Leporte, L. E. (1970). Project 2817 (Report 2), Institute of Paper Science and Technology, Atlanta, GA.
Ramasubramanian, M. K. (2002). “Physical and mechanical properties of towel and tissue,” in: Handbook of Physical Testing of Paper, Mark, R.E. (ed.), Marcel Dekker, Inc., New York, Ch. 12.
Mescher, A. L. (2013). Junqueira’s Basic Histology: Text and Atlas, 13th Edition, McGraw-Hill, New York, NY.
Pan, Y., Habeger Jr., C. C., and Biasca, J. E. (1989). “Empirical relationships between tissue softness and out-of-plane ultrasonic measurements,” Tappi J. 72(11), 95-100.
Paré, M., Elde, R., Mazurkiewicz, J. E., Smith, A. M., and Rice, F. L. (2001). “The Meissner corpuscle revised: A multiafferented mechanoreceptor with nociceptor immunochemical properties,” J. Neurosci. 21(18), 7236-7246. DOI: 10.1523/JNEUROSCI.21-18-07236.2001
Pawlak, J. J., and Keller, D. S. (2004). “Relationships between the local sheet structure and Z-direction compressive characteristics of paper,” J. Pulp Pap. Sci. 30(9), 256-262.
Sanford, L. H., and Sisson, J. B. (1967). “Process for forming absorbent paper by imprinting a fabric knuckle patter thereon prior to drying and paper thereof,” U. S. Patent No. 3301746A.
TAPPI T 410 om-08 (2013). “Grammage of paper and paperboard (weight per unit area)”, TAPPI Press, Atlanta, GA, USA.
TAPPI T 411 om-97 (1997). “Thickness (caliper) of paper, paperboard, and combined board”, TAPPI Press, Atlanta, GA, USA.
Thieulin, C., Pailler-Mattei, C., Vargiolu, R., Lancelot, S., and Zahouani, H. (2017). “Study of the tactile perception of bath tissues and compared results obtained with a human panel and a tribo-acoustic artificial finger,” Colloids and Surfaces B: Biointerfaces 150, 417-425.
Article submitted: July 31, 2018; Peer review completed: September 30, 2018; Revised version received: October 19, 2018; Accepted: October 20, 2018; Published: December 6, 2018.
DOI: 10.15376/biores.14.1.780-795
APPENDIX
Table S1. Results of TS7 and Algorithms of TSA

Table S2. Results of 1- References Panel Score of 13 Panelists
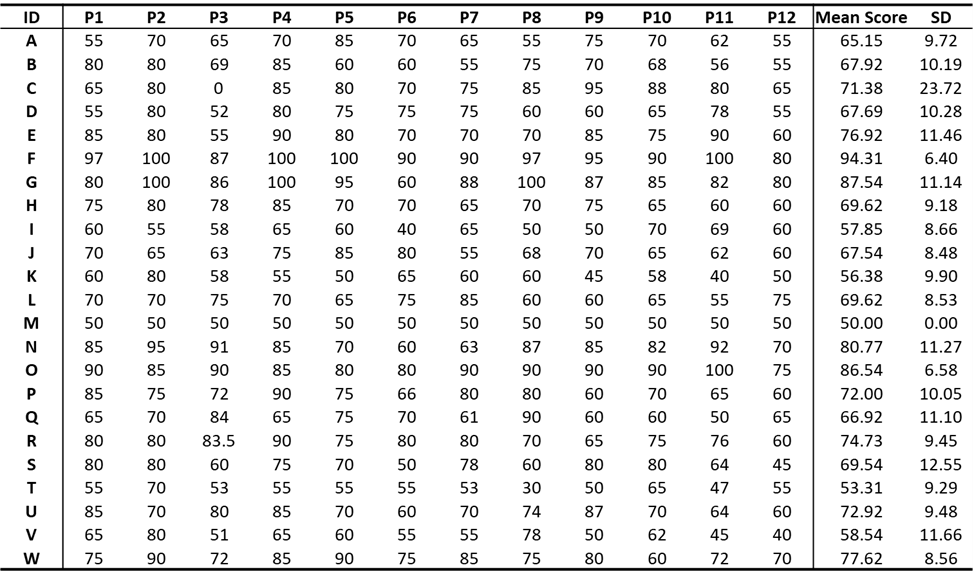
Table S3. Results of 3-References Panel Score of 13 Panelists
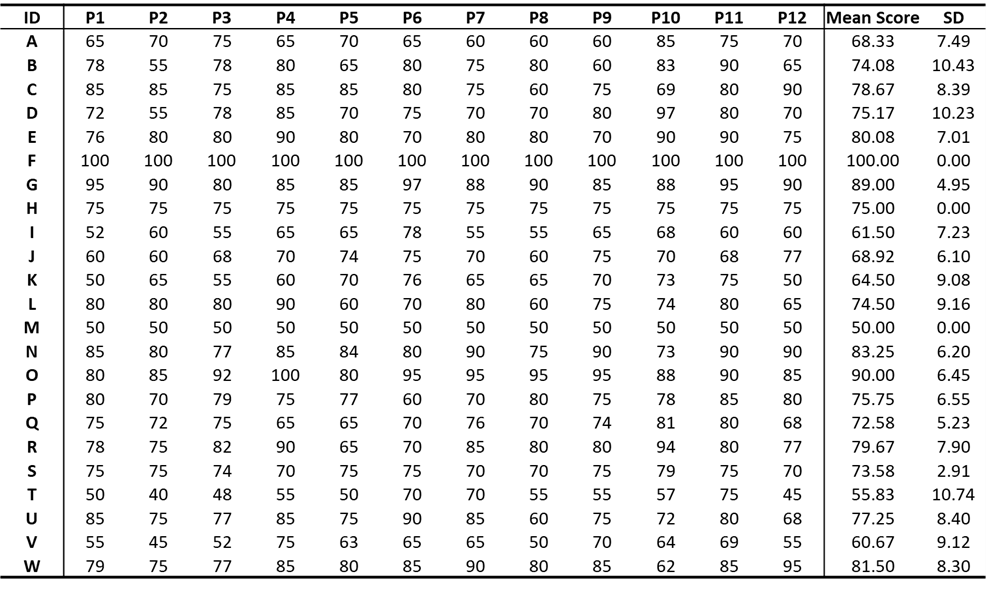
Table S4. Summary of Correlations Between Variables

