
Abstract
Lignin and cellulose were separated from eucalyptus wood powder by partial liquefaction in deep eutectic solvents (DESs). Approximately 97.4% of the original lignin in the eucalyptus wood was separated and recovered with a choline chloride-PEG 200 mixture. Lignin purity that was as high as 99% could be achieved by this separation method. The DES that was comprised of choline chloride, PEG 200, and glycerin could be used to separate the cellulose. The purity and the crystallinity of the isolated cellulose were as high as 92% and 73%, respectively. Experimental data showed that the examined DES systems could effectively separate the constituents of eucalypt wood powder.
Download PDF
Full Article
Separation of Cellulose and Lignin from Eucalyptus Wood by Liquefaction in Deep Eutectic Solvents
Youcan Bai,a Fangeng Chen,a,* and Mingyou Liu b
Lignin and cellulose were separated from eucalyptus wood powder by partial liquefaction in deep eutectic solvents (DESs). Approximately 97.4% of the original lignin in the eucalyptus wood was separated and recovered with a choline chloride-PEG 200 mixture. Lignin purity that was as high as 99% could be achieved by this separation method. The DES that was comprised of choline chloride, PEG 200, and glycerin could be used to separate the cellulose. The purity and the crystallinity of the isolated cellulose were as high as 92% and 73%, respectively. Experimental data showed that the examined DES systems could effectively separate the constituents of eucalypt wood powder.
Keywords: Eucalyptus; Choline chloride; Component separation; Cellulose; Lignin
Contact information: a: State Key Laboratory of Pulp and Paper Engineering, South China University of Technology, Guangzhou 510640, China; b: National Engineering Research Center of Papermaking & Pollution Control, South China University of Technology, Guangzhou 510640, China;
* Corresponding author: fgchen@scut.edu.cn
INTRODUCTION
Lignocelluloses are bio-based polymers comprising cellulose, hemicelluloses, and lignin. The fractionation of these components favors the high-valued utilization of biomass. Successive liquefaction, an important separation technique, has been reported in preparing cellulose microfibers from the holocellulose of banana pseudo-stems with a PEG 400-glycerin medium at 150 °C (Li et al. 2015). The majority of the original lignin and hemicelluloses were liquefied, leaving cellulose undissolved. The resulting cellulose microfibers had a crystallinity of 81.3%, whereas that of the starting holocellulose was 52.2%.
Ionic liquids (ILs) can be good solvents for dissolving cellulose, hemicelluloses, and/or lignin (Lan et al. 2011; Wang et al. 2012; Fort et al. 2016). However, ILs have some drawbacks such as high toxicity, nonbiodegradability, complex synthesis requiring purification, and high cost of the starting materials. Additionally, the ability of ILs to liquefy biomass after repeated recovery and reuse has been noted to decrease (Couling et al. 2006).
Deep eutectic solvents (DESs) are widely acknowledged as a new class of ILs, although they are quite different from one another in composition and properties (Kohli 2019). DESs are a eutectic mixture of Lewis or Brønsted acids and bases that can contain a variety of anionic and/or cationic species. In contrast, ILs are composed of one discrete anion and cation pair (Smith et al. 2014). DESs are usually cheaper and less toxic than ILs. In addition, DESs retain most of their original activity after repeated reuse during biomass liquefaction (Procentese et al. 2015).
DESs prepared from quaternary ammonium salts and different hydrogen bond donors (e.g., carboxylic acids and polyalcohols) can selectively dissolve lignin from plant fibers and leave the majority of the cellulose and hemicelluloses undissolved (Francisco et al. 2012). This procedure can be used as a pretreatment of lignocellulose biomass in its conversion to bio-ethanol (Kumar et al. 2016). DESs could also been used to replace the oxygen delignification after kraft pulping (Majová et al. 2017). Alvarez-Vasco et al. (2016) succeeded in dissolving lignin from wood fibers using DES prepared from choline chloride (as a hydrogen acceptor) combined with various hydrogen-bond donors (i.e., acetic acid, lactic acid, levulinic acid, and glycerol). They reported that 78% of the white poplar wood lignin, as well as 58% of the fir wood lignin, was dissolved. The dissolved lignin (95.4% purity) was precipitated from the DES with deionized water. The recovered lignin had a low molecular weight and a narrow molecular weight distribution. The lignin could not be dissolved completely during the liquefaction, so that the liquefaction residue still contained a considerable portion of lignin.
It is well known that plant fibers can easily be liquefied in hydrogen-donor solvents, such as glycerol and PEG 400, in the presence of a catalytic amount of sulfuric acid. In contrast, the liquefaction of plant fiber in DESs is incomplete. During the liquefaction in DES, lignin can be partially dissolved, leaving cellulose and hemicelluloses in the residue. Increasing the dosage of hydrogen-bond donors in DESs is expected to improve the dissolution of hemicelluloses and cellulose.
In this work, several hydrogen bond donors (i.e., PEG 200, lactic acid, and glycerol) were added to choline chloride respectively to form the liquefying media. PEG 200 was used in place of PEG 400 because it has a lower viscosity and a higher hydroxyl content than PEG 400; this should result in the formation of additional hydrogen bonds in the DES system. Lactic acid and glycerin, when mixed with choline chloride, should improve the dissolution of lignin (Procentese et al. 2015; Kumar et al. 2016). The isolation of cellulose and lignin from eucalypt fibers can be accomplished by successive liquefaction of wood powder with the catalytic addition of sulfuric acid. The influences of solvent type, reaction time, and reaction temperature on the yields and purities of isolation products were investigated.
EXPERIMENTAL
Materials
Eucalyptus wood (Eucalyptus exserta (F. V. Muell)) was obtained from Leizhou (Guangdong Province, China). It was ground to a 50-mesh powder prior to use. The screened wood powder contained 45.3% cellulose, 67.0% holocellulose, and 30.8% lignin. The content of ash and benzene-ethanol extractive were 0.3% and 1.2%, respectively. The data above were determined according to Chinese National Standard GB/T 2677.2~GB/T 2677.10.
All the chemical reagents used in this work were commercial products. Glycerol, PEG 200, and 1,4-dioxane, were of reagent grade and were used without further purification. Lactic acid and choline chloride were produced by Shanghai Macklin Biochemical Co., Ltd. (Shanghai, China).
Methods
Preparation and characterization of DESs
Four DESs, designated DES 1, DES2, DES3, and DES4, were prepared by mixing choline chloride with lactic acid, glycerin, PEG 200, and PEG 200-glycerin (4:1, v/v) mixture, with 1:4 weight ratio, respectively. The viscosities of them at 25 °C were 84, 130, 61, and 42 mPa∙s, respectively. The powder was mixed with the selected DES using a 1:4 powder-to-medium ratio (w/w) at room temperature. The mixture was then heated for 0.5 h at 60 °C. The viscosity of the DESs was measured using a NDJ-8S rotary viscometer (Shanghai Fangrui Instrument Co., Ltd.; Shanghai, China) at 251 °C.
Separation of eucalypt wood components
A total amount of 50 mL of DES was added to a 3-neck flask equipped with a thermometer, stirrer, and condenser. To the DES was added 5 g of dried wood powder and 0.2 to 1.5 mL of 98% sulfuric acid. Then, the flask was heated to the desired temperature and kept at that temperature for 3 h. After the liquefaction reaction, the flask was placed into a cool water bath to terminate the reaction.
The reaction mixture was filtered with a G3 sintered glass funnel. As the DESs were viscous, the mixture was diluted with a 1,4-dioxane-water mixture (4:1 v/v) before filtration. The solid residue was washed with 1,4-dioxane-water mixture until the filtrate was colorless. The filtered and washed solid was then vacuum-dried. The cellulose content in the resulting residual was measured by the nitric acid-ethanol method of Loow et al. (2017). The filtrate was concentrated by rotary evaporation. The resulting concentrate was mixed with 400 mL of deionized water to form a precipitate, which was filtered with a G4 sintered glass funnel. The precipitate (which was predominantly lignin) was washed with deionized water repeatedly until the eluent became colorless. Then, the washed precipitate was vacuum-dried to obtain the crude lignin. The purity of the crude lignin was measured using TAPPI T222 om-11 (2011). The yield and purity of the separated components of the wood powder were calculated according to the following equations,
YC=mC/m0 × 100% (1)
YL=mL/m0 × 100% (2)
PC=mPC/mC × 100% (3)
PL=mPL/mL × 100% (4)
where YC and YL represent the yields of crude cellulose and crude lignin, respectively; PC and PL represent the purity of the crude cellulose and crude lignin, respectively; mC is the mass of crude cellulose; mL is the mass of crude lignin; mPC is the mass of the residual solid obtained by the nitric acid-ethanol method (i.e., pure cellulose); mPL is the total mass of lignin calculated from the sum of acid-insoluble lignin and acid-soluble lignin (determined by TAPPI T222 om-11 (2011)); and m0 is the mass of raw wood powder. All the liquefaction experiments were repeated 3 times, and the results were averaged.
The liquefaction conditions were optimized based on the yield of lignin. In subsequent experiments, the samples used were prepared from the crude cellulose and crude lignin that were obtained under optimal liquefaction conditions. The crude lignin and crude cellulose samples were designated L1 through L4 and C1 through C4, respectively.
Gel permeation chromatography (GPC) analysis
The molecular weight and molecular weight distribution of lignin were measured by GPC on an Agilent 1100 HPLC instrument (Agilent Technologies Inc.; Palo Alto, CA, USA) equipped with PL1110-6300 and PL1110-6530 columns. Tetrahydrofuran (THF) was used as the eluent. The lignin samples were acetylated with acetic anhydride in pyridine prior to GPC analysis. The GPC columns were calibrated using narrow-distributed polystyrene standards. The injection volume was 20 μL for each run. The column temperature was maintained at 40±0.1 °C.
Fourier transform infrared (FT-IR) spectroscopy
The FT-IR spectra of lignin and cellulose samples were recorded using a Vector 33 FT-IR spectrophotometer (Bruker; Ettlingen, Germany) over the wavenumber range of 4000 to 400 cm-1. Approximately 3-mg samples were well mixed into 200 to 250 mg of fine KBr powder, then finely pulverized and placed into a pellet-forming die. A force of approximately 8 tons was applied under a vacuum for 5 min to form transparent pellets.
Thermogravimetric analysis (TGA)
TGA was performed using a Q500 Thermogravimetric Analyzer (TA Instruments; New Castle, DE, USA). The samples were heated from 40 to 700 °C at a heating rate of 10 °C /min under a nitrogen blanket at a flow rate of 25 mL/min.
Determination of degree of polymerization of cellulose
The average degree of polymerization (DP) of cellulose was calculated from the intrinsic viscosity of cellulose dissolved in cupriethylenediamine (CED) solution (in accordance with ISO 5351 (2010). The viscosity was measured using an Ubbelhode viscometer with a capillary diameter of 0.8 mm at 251 °C. The average DP of cellulose was calculated based on the Mark-Houwink-Sakurada equation,
[η] = K × DPα (5)
where [η] is the intrinsic viscosity of the cellulose solution. The values of K and α are 1.33 g/mL and 0.905, respectively, for cellulose in a CED solution, according to ISO 5351 (2010).
X-ray powder diffraction (XRD) analysis
The crystallinity of crude cellulose was quantified by XRD using a Rigaku SmartLab SE polycrystalline X-ray diffractometer (Rigaku; Tokyo, Japan). The testing conditions were as follows: Cu K radiation of wavelength 0.15418 nm, scanning step length 0.04°, and scanning speed 0.2 s/step. The crystallinity index (CrI) was calculated as follows,
CrI = [(I2-I1)/I2] × 100% (6)
where I1 and I2 represent the peek intensities recorded at 18.5° and 22.6°, respectively, for crystalline and amorphous cellulose.
13C-NMR spectra characterization
The 13C NMR spectra of the samples were recorded using an Avance-3-HD 400 spectrometer (Bruker; Ettlingen, Germany) following Robert (1992). Two hundred milligrams of each sample were dissolved in 1 mL of deuterated dimethylsulfoxide (DMSO-d6) at room temperature. The main parameters were as follows: NMR tube diameter 5 mm, scan width 200 ppm, NS = 15,000, TD = 32,768, LB = 10 Hz, pulse angle 90°. No internal standards were used. The 13C-NMR scanning time was 8 h for each sample.
RESULTS AND DISCUSSION
Selection of Liquefaction Agents
Theoretically, polyethylene glycols (PEGs) of any molecular weight can be used in the partial liquefaction of woody biomasses because all PEGs are hydrogen bond donors. However, the preliminary experiments indicated that the lignin yield was low when PEG 400 or PEG 400-glycerin was mixed with choline chloride as the liquefaction medium. In this study, PEG 200 was used instead of PEG 400 because the former contains more hydroxyl groups and is less viscous, which helps to improve the ability to penetrate the fibers to rapidly dissolve them. The composition of the PEG-glycerin mixture was set with reference to the authors’ previous work (Liu et al. 2009).
Unlike the liquefaction in DESs, the liquefaction of lignocellulose in polyhydric alcohols should be catalyzed by sulfuric acid or other strong acids. The liquefaction procedure in this work combined two types of liquefaction to improve the dissolution of lignin and hemicellulose. The influences of sulfuric acid concentration on the yield of liquefaction residue and crude lignin were studied. The reaction lasted 120 min at 140 °C.

Fig. 1. Yield of residue (a) and crude lignin (b) at various sulfuric acid concentrations (wt%)
Figure 1 shows the yields of residue and crude lignin by addition of different dosage of sulfuric acid. It was found that increasing the concentration of sulfuric acid significantly reduced the residue yield in the liquefaction media containing PEG or glycerin, while the effect was not so obvious in the choline chloride-lactate liquefaction medium. As a matter of fact, sulfuric acid is seldom used in the choline-lactic acid system. In this study, the dosage of sulfuric acid was chosen at 1 mL to ensure that the reaction proceeded at a relatively high rate.
Influence of Reaction Conditions on the Yield of Separated Products
Figure 2 shows the impact of temperature on the yield of liquefaction residue and crude lignin. Reduced residue and increased crude lignin yields could be achieved at enhanced temperature. The reason for these observations was that increasing the temperature provided more energy to cleave the covalent bonds connecting the various constituents, which promoted wood dissolution. The yields of both residue and lignin remained relatively unchanged when the DES temperature was increased above 140 °C, which indicated that most of the lignin and hemicelluloses, as well as amorphous cellulose, was transferred into the liquid phase. Based on the lignin yield levels, 140 °C was recognized as the optimal DES temperature for the liquefaction.

Fig. 2. Yield of residue (a) and crude lignin (b) at various DES temperatures, with a reaction time of 120 min
It was found that the dominant component of the solid residue was cellulose. For example, more than 90 wt.% of the residue was cellulose for the DES4 liquefaction medium. The residue yield in this work was higher than that of wood liquefaction in ethylene glycol with sulfuric acid (Rezzoug and Capart 2003), in which most of the lignocellulose was converted into liquid products. PEG with or without glycerin, when being used in the presence of sulfuric acid, is a strong liquefaction medium to break the linkage between the components of lignocellulose. The reaction medium used in this research, however, was a mixture of a hydrogen bond donor and choline chloride. The DES can selectively cleave the ether linkage between lignin units and then produce hydroxyls (Alvarez-Vasco et al. 2016; Loow et al. 2017). Lignin and hemicelluloses are easily dissolved by hydrogen-donor solvents because these two constituents are not crystalline. The ether linkages connecting the hemicelluloses to the lignin are thus easily cleaved. However, the highly ordered structure with crystalline cellulose restricts dissolution in hydrogen-donor media. The recovery of relatively pure crude lignin and cellulose fractions demonstrates that the liquefying agent used in this work is selective for separating these constituents.

Fig. 3. Yield of crude cellulose (a) and crude lignin (b) at various reaction times in various DESs
The yields of crude cellulose and crude lignin versus time are shown in Fig. 3. The experiments were conducted in various DESs at 140 °C. At the beginning of the liquefaction, the residue yield could be thought of as 100% because no wood components were dissolved. The yield of residue (could be recognized as “crude cellulose”) was reduced at time 20 min, indicating that the wood components were being separated. Afterward, the yield of crude cellulose decreased slowly, while that of crude lignin increased slowly. Among the wood components, hemicelluloses and lignin reacted with the liquefying agent more easily than cellulose did. This rapidly reduced the amount of solid residue within a short time period. The liquefaction of amorphous cellulose was easier than that of crystalline cellulose. After 120 min, the yields of lignin and cellulose leveled out; hence, it was determined that a reaction time of 120 min was optimal.
In this work, the changes of hemicelluloses were not investigated because the recovery of hemicellulose was not included.
Influence of Reaction Conditions on the Purity of Cellulose and Lignin
Figure 4 shows that increasing the DES treatment temperature increased the purity of the crude cellulose. The results indicate that increasing the temperature increases the difference in the dissolution rate of wood components. The use of DES1 and DES2 resulted in lower cellulose purity in the crude solids than did the use of DES3 and DES4. The former DES media were not as effective at dissolving lignin and hemicelluloses in the eucalypt wood powder as the latter DES media. Undissolved lignin and hemicelluloses remained in the crude cellulose as impurities. Generally, the off-color of the crude cellulose could be attributed to the presence of dark-colored lignin. As demonstrated in Fig. 4, the cellulose separated by DES4 had the lightest color, demonstrating that it had the least amount of residual lignin remaining. Based on the experimental results, PEG 200 or PEG 200/glycerol dissolved more lignin than did lactic acid or glycerol. Part of the discoloration of the crude cellulose could be due to carbonization of the wood fibers in the eucalypt powder. From TGA, the char residue contents of crude cellulose obtained from DES1 and DES2 were relatively high in elemental carbon. This was attributed to the wood fibers being partially carbonized in the presence of sulfuric acid. Highly pure crude cellulose was achieved when using DES3 or DES4. For instance, a maximum cellulose purity of 92% was obtained using the DES4 treatment.

Fig. 4. Purity of crude cellulose (a) and crude lignin (b) obtained at different reaction temperatures with various DESs
Figure 4 indicates that all the crude lignin obtained from various DESs, except for that obtained from DES4, were high in purity. The purity could be up to 99%. It appears that the use of DES4 resulted in the extraction of some water-insoluble impurities from the hemicelluloses and/or cellulose, so that the purity of crude lignin obtained from DES4 was low. Some of the DESs used in this study contained PEG 200 and glycerin, which are widely used liquefying media for wood. Almost all wood constituents, including cellulose, can be easily dissolved in these media (Yao et al. 1993). Therefore, during the separation of lignin with DES4, cellulose and hemicelluloses, as well as their degradation products, may have been extracted along with lignin; this could then be co-precipitated in subsequent steps, reducing the purity of the fractionated lignin. The color of crude cellulose samples (Fig. 5) was in good agreement with the purity of crude cellulose.

Fig. 5. Appearance of crude cellulose separated by various DESs (140 °C for 90 min) (C1) DES1, (C2) DES2, (C3) DES3, and (C4) DES4
The Separation Efficiency of Lignin
The yields of crude lignin separated by DES1~DES4 obtained at 140°C are listed in Table 1. The data of crude lignin yield are based on the weight of wood powder.
Table 1. Yield of Crude Lignin and Separation Efficiency by Different DESs
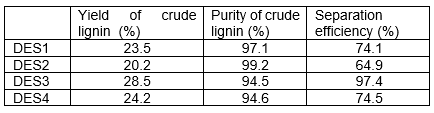
Characterization of Crude CelluloseAs the lignin content in wood powder was 30.8% and that the purity of crude lignin obtained by DES3 were 94.3% at 140 °C (as shown in Fig. 3), the separation efficiency of lignin by DES3 was calculated as 97.4%. The separation efficiency of lignin by other DESs were lower, as shown in Table 1.
The sawdust and isolated crude cellulose were characterized, and the results are shown in Fig. 6.

Fig. 6. Eucalyptus wood powder (sawdust) and isolated crude cellulose from different DESs a: FT-IR spectra; b: TGA curves; c: XRD peaks; (C1) DES1, (C2) DES2, (C3) DES3, and (C4) DES4
Figure 6a shows the FT-IR spectra of the raw wood powder (sawdust) and the crude cellulose samples from the four DES treatments. Absorption peaks observed at 1605, 1510, and 826 cm-1 were assigned to C=C stretching and C-H stretching vibrations of the aromatic ring (Schwanninger et al. 2004; Derkacheva and Sukhov 2010). The intensities of peaks at 1605, 1510, and 826 cm-1 in the C1 (DES1) and C2 (DES2) spectra were weaker than those in the wood powder, whereas these peaks in the C3 (DES3) and C4 (DES4) spectra were absent. These observations suggest that trace amounts of residual lignin were present in C1 and C2, whereas almost no lignin remained in C3 and C4. The peak at 1730 cm-1 was assigned to C=O stretching vibrations in acetyl groups, which are primarily found in the xylan in the hemicelluloses. The strong intensity of this peak in the C1 spectra suggests that the crude cellulose contained appreciable amounts of hemicelluloses.
The TGA curves of the isolated crude cellulose samples (Fig. 6b) showed a maximum thermal decomposition rate at ca. 300 °C. All samples, except for C1, had similar TG curves. The C1 curve had a wide thermal decomposition temperature range, demonstrating that the C1 sample contained many components in addition to cellulose. The relatively low decomposition temperature of the C1 sample could be assigned to the existence of residual lignin.
Usually, the thermal decomposition of lignin happens in a wide temperature range, e.g., from ambient to 900 °C, but at a low weight loss rate (Yang et al. 2007). Hence, it is reasonable that C1, which contains more lignin than other crude cellulose samples, would have the lowest thermal decomposition temperature. The residual char yields of C1 and C2 at temperatures above 500 °C were between 12 and 16 wt.%, respectively, whereas the residual char yields of C3 and C4 were below 10 wt.%. As mentioned earlier, a portion of the raw material was carbonized by the sulfuric acid in DES1 and DES2 media, which resulted in higher char levels during the TGA. The DP of the crude cellulose C1 obtained from DES1 is the lowest, which suggests that its stability is also low (Table 2); this may explain the low thermal decomposition temperature observed for C1. The DP of the crude cellulose C2 obtained from DES2 is the highest, which indicates that the cellulose was not as degraded as the cellulose obtained with the other DESs.
Table 2. Degree of Polymerization (DP) of Crude Cellulose Obtained Using Various DESs

The X-ray diffraction peaks of the crude cellulose are shown in Fig. 5c. Based on the XRD patterns (French and Cintrón 2013), the crystallinities of C1, C2, C3, and C4 were calculated to be 55.14%, 66.51%, 66.79%, and 73.19%, respectively. Sample C4 had the highest cellulose crystallinity, which indicated that most of the amorphous cellulose had been degraded and removed. Moreover, it may be used as a raw material for crystalline cellulose because of its high crystallinity. As mentioned above, the hydrogen bond donors in DESs could promote the dissolution of cellulose. It is possible that the PEG 200/glycerin medium gave the strongest ability to dissolve cellulose, so that the non-crystalline cellulose, and even some crystalline cellulose, was liquefied. In contrast, the capacity of lactic acid to dissolve the degradation products was poor under these conditions, which resulted in a crude cellulose sample (C1) with a low degree of crystallinity.
Characterization of Crude Lignin
The crude lignin samples obtained by DESs were also characterized. In the FT-IR spectra of the isolated crude lignin samples, the absorption peaks typically associated with xylan in the hemicelluloses were not observed (Fig. 7a). The absorption at 1710 cm-1, which is assigned to non-conjugated carbonyls (C=O), was noted. Absorptions peaks assigned to the aromatic rings (1605, 1510, and 1118 cm-1) were more prominent in the crude lignin samples than in the raw wood powder, which implies that almost all the hemicelluloses were removed. A low-intensity peak at 1163 cm-1, which was assigned to the skeletal vibration of the C-O bond in cellulose, was observed in the L3 and L4 samples; this peak was absent in the L1 and L2 samples. The weak intensity of this IR peak qualitatively shows that the contents of cellulose and its degradation products in the crude lignin samples were low. The FT-IR observations seem to be consistent with other analytical results regarding the purity of the isolated crude lignin fraction.

Fig. 7. Some characteristics of eucalypt sawdust and crude lignin isolated from DES1~DES4 (L1~L4); a: FT-IR spectra; b: TGA weight loss curves; c: 13C-NMR spectra
The TGA curves of crude lignin samples show that thermal weight losses occurred in the temperature range of 200 to 550 °C. The rates of thermal weight losses of the samples were rapid (Fig. 6b) and were similar to lignin thermal decomposition curves reported in the literature (Ferdous et al. 2001; Zhang et al. 2012). These thermal decomposition curves of crude lignin were not appreciably different from one another, except for the onset decomposition temperature and the residual char content. Differences in decomposition temperature can be attributed to structural changes in lignocellulose after treatment with various DES processes. The L1 sample had a slightly lower decomposition temperature than the other three samples, which indicates that the thermal stability of L1 was low and that it could be more easily degraded than the other samples. The molecular weight of L1 was also lower than the other three crude lignin samples (Table 3), which indicates that the isolated lignin sample had the lowest stability. The remaining char solids of L1 and L2 were ca. 44%, whereas those for the other two samples (L3 and L4) were approximately 35% to 38%.°
Table 3. Molecular Weight and Molecular Weight Distribution of Crude Lignin Samples

The molecular weight of sample L1 was the lowest (Table 3). This is because DES1 contained lactic acid, which showed stronger hydrogen bonding than other DESs and could easily combine with lignin. In this case, lignin was easily degraded (Loow et al. 2017). Simultaneously, the molecular weight of sample L2 was the highest. A reasonable explanation is that DES2 presented the highest viscosity among the DESs, which may have obstructed dissolution.
Table 4. Molecular Weights and Molecular Weight Distributions for Crude Lignin Samples Separated by DES3 after Various Reaction Times

Approximately 97.4% of the lignin from the eucalypt wood powder was isolated using the DES3 medium; this medium was used in further experiments with various reaction times (Table 3). It was observed that the Mw (weight-averaged molecular weight) and Mn (number-averaged molecular weight) values for the isolated lignins increased as the DES3 reaction time increased. It seems that low-molecular-weight lignin dissolved prior to high-molecular-weight lignin fragments. This observation was assumed to be caused by lignin condensation reactions that occurred with the dissolved lignin with itself and with dissolved lignin in the medium with bound residual lignin in the wood powder. However, the polydispersity index values (i.e., Mw/Mn) did not appreciably change as the DES3 reaction time increased. This observation suggests that lignin degradation or self-condensation was synchronized, which resulted in the polydispersity index being unchanged. The lignin’s molecular weights suggest that the isolated crude lignin had Mw values that are appropriate for melt spinning.
The lignin samples separated by different DESs were characterized by 13C-NMR (Fig. 6c). The 13C-NMR signal assignments for different functional group that are reported in the literature (Chen and Robert 1988; Gonçalves et al. 2000) were used to characterize the isolated DES lignins (Table 4). The chemical shifts at 10 and 50 ppm are related to the carbon atoms of the aliphatic chain of lignin. Multiple resonance signals were observed in this range (Fig. 6c); the L1 sample had the highest intensity of all the isolated lignin samples. The 130 ppm peak is associated with the aromatic C-2 and C-6 positions of the p-hydroxyphenyl units of lignin. When comparing the four samples to one another, only the L2 sample did not have the 130 ppm signal. This suggested that there were no p-hydroxyphenyl units in sample L2. This signal was observed in the other three lignin samples.
Comparisons among of the spectra of the isolated lignins (Fig. 6c) show that sample L1 had two weaker peaks at 72.2 ppm and 69.7 ppm, which were more prominent than in the other samples. These two peaks are assigned to the β–O-4 linkages in lignin and to the lignin-xylan ether linkages. The level of these two linkages in the L1 sample was the lowest (Table 5). This suggests that sample L1 contained fewer carbohydrate contaminants, or fewer lignin-carbohydrate complexes (LCCs), either occurring naturally or resulting from condensation reactions during the DES reaction. In addition, the low intensity of this signal implies that a major portion of the β–O-4 linkages in the L1 sample were cleaved. The β–O-4 linkage is the most common linkage found in native lignin. Hence, it was deduced that the L1 sample was severely degraded. The findings from the 13C-NMR analyses are consistent with the results observed in the GPC analyses.
CONCLUSIONS
- Lignin and cellulose could be separated by partial liquefaction in a choline chloride-PEG 200 medium. Satisfactory lignin yields (up to 97.4%) and lignin purities (up to 99%) were achieved. The choline chloride-PEG 200-glycerin medium selectively fractionated the cellulose from the lignin in the wood powder.
- The isolated cellulose samples had purities of up to 92% and had a high degree of crystallinity.
- The isolated crude lignins had Mw values that were appropriate and did not have appreciable levels of self-condensation during the DES reactions.
ACKNOWLEDGMENTS
The authors would like to acknowledge the support from the State Key Laboratory of Pulping and Paper Engineering, South China University of Technology (Grant No. 2015C01).
REFERENCES CITED
Alvarez-Vasco, C., Ma, R., Quintero, M., Guo, M., Geleynse, S., Ramasamy, K. K., Wolcott, M., and Zhang, X. (2016). “Unique low-molecular-weight lignin with high purity extracted from wood by deep eutectic solvents (DES): A source of lignin for valorization,” Green Chemistry 18(19), 5133-5141. DOI: 10.1039/C6GC01007E
Chen, C. L., and Robert, D. (1988). “Characterization of lignin by 1H and 13C NMR spectroscopy,” Methods in Enzymology, Biomass Part B: Lignin, Pectin, and Chitin 161, 137-174. DOI: 10.1016/0076-6879(88)61017-2
Couling, D. J., Bernot, R. J., Docherty, K. M. J., Dixon, N. K., and Maginn, E. J. (2006). “Assessing the factors responsible for ionic liquid toxicity to aquatic organisms via quantitative structure–property relationship modeling,” Green Chemistry 8(1), 82-90. DOI: 10.1039/b511333d
Derkacheva, O., and Sukhov, D. (2010). “Investigation of lignins by FT-IR spectroscopy,” Macromolecular Symposia 265(1), 61-68.
Ferdous, D., Dalai, A. K., Bej, S. K., and Bakhshi, N. N. (2001). “Reduction of H2 and medium Btu gas via pyrolysis of lignins in affixed-bed reactor,” Fuel Processing Technology 70(1), 9-26. DOI: 10.1016/S0378-3820(00)00147-8
Fort, D. A., Remsing, R. C., Swatloski, R. P., Moyna, P., Moyna, G., and Rogers, R. D. (2016). “Can ionic liquids dissolve wood? Processing and analysis of lignocellulosic materials with 1-n-butyl-3-methylimidazolium chloride,” Green Chemistry 9(1), 63-69. DOI: 10.1039/b607614a
Francisco, M., van den Bruinhorst, A., and Kroon, M. C. (2012). “New natural and renewable low transition temperature mixtures (LTTMs): Screening as solvents for lignocellulosic biomass processing,” Green Chemistry 14(8), 2153-2157. DOI: 10.1039/c2gc35660k
French, A. D., and Cintrón, M. S. (2013). “Cellulose polymorphy, crystallite size, and the Segal crystallinity index,” Cellulose 20(1), 583-588. DOI: 10.1002/masy. 200850507
Gonçalves, A. R., Schuchardt U., and Bianchi M. L. (2000). “Piassava fibers (Attalea funifera): NMR spectroscopy of their lignin,” Journal of the Brazilian Chemical Society 11(5), 491-494. DOI: 10.1590/S0103-50532000000500010
ISO 5351. (2010). “Pulps – Determination of limiting viscosity number in cupriethylenediamine (CED) solution,” International Organization for Standardization, Geneva, Switzerland.
Kohli, R. (2019). “Applications of ionic liquids in removal of surface contaminants,” in: Developments in Surface Contamination and Cleaning: Applications of Cleaning Techniques, Elsevier Inc, Amsterdam, Netherlands, pp. 619-680. DOI: 10.1016/B978-0-12-815577-6.00016-5
Kumar, A. K., Parikh, B. S., and Pravakar, M. (2016). “Natural deep eutectic solvent mediated pretreatment of rice straw: Bioanalytical characterization of lignin extract and enzymatic hydrolysis of pretreated biomass residue,” Environmental Science and Pollution Research 23(10), 9265-9275. DOI: 10.1007/s11356-015-4780-4
Lan, W., Liu, C. F., and Sun, R. C. (2011). “Fractionation of bagasse into cellulose, hemicelluloses, and lignin with ionic liquid treatment followed by alkaline extraction,” Journal of Agricultural and Food Chemistry 59(16), 8691-8701. DOI: 10.1021/jf201508g
Li, W., Zhang, Y. C., Li, J. H., Zhou, Y. J., Li, R. S., and Zhou, W. (2015). “Characterization of cellulose from banana pseudo-stem by heterogeneous liquefaction,” Carbohydrate Polymers 132, 513-519. DOI: 10.1016/j.carbpol.2015.06.066
Liu, J. J., Chen, F. G., and Qiu, M. H. (2009). “Liquefaction of bagasse and preparation of rigid polyurethane foam from liquefaction products,” Journal of Biobased Materials and Bioenergy 3(4), 401-407. DOI: 10.1166/jbmb.2009.1050
Loow, Y. L., New, E. K., Yang, G., Ang, L. Y., Foo, L. Y. W., and Wu, T. (2017). “Potential use of deep eutectic solvents to facilitate lignocellulosic biomass utilization and conversion,” Cellulose 9, 1-28. DOI: 10.1007/s10570-017-1358-y
Majová, V., Horanová, S., Škulvová, A., Šima, J., and Jablonský, M. (2017). “Deep eutectic solvent delignification: impact of initial lignin,” BioResources 12(4), 7301-7310. DOI: 10.1537/biores.12.4.7301-7310
Procentese, A., Johnson, E., Orr, V., Campanile, A. G., Wood, J. A., Marzocchella. A., and Rehmann, L. (2015). “Deep eutectic solvent pretreatment and subsequent saccharification of corncob,” Bioresource Technology 192, 31-36. DOI: 10.1016/j.biortech.2015.05.053
Pu, Y., Jiang, N., and Ragauskas, A. J. (2007). “Ionic liquid as a green solvent for lignin,” Journal of Wood Chemistry and Technology 27(1), 23-33. DOI: 10.1080/02773810701282330
Rezzoug, S. A., and Capart, R. (2003). “Assessment of wood liquefaction in acidified ethylene glycol using experimental design methodology,” Energy Conversion and Management 44(5), 781-792. DOI: 10.1016/s0196-8904(02)00088-2
Robert, D. (1992). “Carbon-13 nuclear magnetic resonance spectrometry,” in: Methods in Lignin Chemistry, Lin, S. Y. and Dence, C. W. (eds.), Springer-Verlag, Berlin, pp. 250-273.
Schwanninger, M., Rodrigues, J.C., Pereira, H., and Hinterstoisser, B. (2004). “Effects of short-time vibratory ball milling on the shape of FT-IR spectra of wood and cellulose,” Vibrational Sprctroscoy 36(1), 23-40. DOI: 10.1016/j.vibspec.2004.02. 003
Smith, E. L., Abbott, A. P., and Ryder, K. S. (2014). “Deep eutectic solvents (DESs) and their applications,” Chemical Reviews 114(21), 11060-11082. DOI: 10.1021/cr300162p
TAPPI T222 om-11. (2011). “Acid-insoluble lignin in wood and pulp,” TAPPI Press, Atlanta, GA, USA.
Wang, H., Gurau, G., and Rogers, D. (2012). “Ionic liquid processing of cellulose,” Chemical Society Reviews 41, 1519-1537. DOI: 10.1039/c2cs15311d
Yang, H., Yan, R., Chen H., Lee, D. H., and Zheng C. (2007). “Characteristics of hemicellulose cellulose and lignin pyrolysis,” Fuel 86(12-13), 1781-1788. DOI: 10.1016/j.fuel.2006.12.013
Yao, Y. G., Yoshioka, M., and Shiraishi, N. (1993). “Combined liquefaction of wood and starch in a polyethylene glycol/glycerin blended solvent,” Mokuzai Gakkaishi 39(8), 9380-9386.
Zhang, M., Resende, F. L. P., Moutsoglou, A., and Raynie, D. E. (2012). “Pyrolysis of lignin extracted from prairie cordgrass, aspen, and kraft lignin by Py-GC/MS and TGA/FTIR,” Journal of Analytical and Applied Pyrolysis 98, 2-7. DOI: 10.1016/j.jaap.2012.05.009
Article submitted: July 2, 2019; Peer review completed: April 25, 2020; Revised version received: July 3, 2020; Accepted: July 4, 2020; Published: July 21, 2020.
DOI: 10.15376/biores.15.3.6886-6901