
Abstract
Through-tenon joints are widely used in ancient timber buildings. To study the influence of the gaps between mortise and tenon shoulder on the seismic performance of through-tenon joints, a 1:3.52 scaled model was constructed and used for low cyclic loading test. Finite element analysis was conducted to study the mechanical behavior of the through-tenon joint. The seismic performance parameters of the model such as moment-rotation hysteresis curves, envelope curves, degradation of rigidity, and energy dissipation capacity were compared. The analyses showed similar changing characteristics, which indicated that the finite element analysis results were reliable. Based on the results, 7 through-tenon joint finite element analysis models with different gaps between mortise and tenon shoulder were established. The seismic performance of each of the through-tenon joints with different gaps between mortise and tenon shoulder were studied. The moment-rotation hysteresis curve of the through-tenon joint had an obvious pinching effect, and the through-tenon joint had good rotational loading capacity and good deformation ability. The peak rotational loading capacity, initial stiffness, and energy dissipation capacity of the joint decreased, while the gap between mortise and tenon shoulder increased.
Download PDF
Full Article
Study on the Seismic Performance of Through-tenon Joints with Pullout Tenon Gaps between Mortise and Tenon Shoulder
Junhong Huan,a,b,c,d Zemeng Sun,a,b Xiaodong Guo,c,d,* Tianyang Chu,a,b Xiaoyi Zhou,a,b Wei Wang,c,d and Yating Yang c,d,e
Through-tenon joints are widely used in ancient timber buildings. To study the influence of the gaps between mortise and tenon shoulder on the seismic performance of through-tenon joints, a 1:3.52 scaled model was constructed and used for low cyclic loading test. Finite element analysis was conducted to study the mechanical behavior of the through-tenon joint. The seismic performance parameters of the model such as moment-rotation hysteresis curves, envelope curves, degradation of rigidity, and energy dissipation capacity were compared. The analyses showed similar changing characteristics, which indicated that the finite element analysis results were reliable. Based on the results, 7 through-tenon joint finite element analysis models with different gaps between mortise and tenon shoulder were established. The seismic performance of each of the through-tenon joints with different gaps between mortise and tenon shoulder were studied. The moment-rotation hysteresis curve of the through-tenon joint had an obvious pinching effect, and the through-tenon joint had good rotational loading capacity and good deformation ability. The peak rotational loading capacity, initial stiffness, and energy dissipation capacity of the joint decreased, while the gap between mortise and tenon shoulder increased.
DOI: 10.15376/biores.19.1.322-344
Keywords: Finite element analysis; Through-tenon joint; Seismic performance; Gap between mortise and tenon shoulder
Contact information: a: School of Civil Engineering, Shijiazhuang Tiedao University, Shijiazhuang 050043, China; b: Key Laboratory of Roads and Railway Engineering Safety Control (Shijiazhuang Tiedao University), Ministry of Education, Shijiazhuang 050043, China; c: Faculty of Architecture, Civil and Transportation Engineering, Beijing University of Technology, Beijing 100124, China; d: Key Scientific Research Base of Safety Assessment and Disaster Mitigation for Traditional Timber Structure (Beijing University of Technology), State Administration for Cultural Heritage, Beijing 100124, China; e: The College of Urban Construction, Hebei Normal University Of Science & Technology, Qinhuangdao 066000, China; *Corresponding author: guoxd7797@163.com
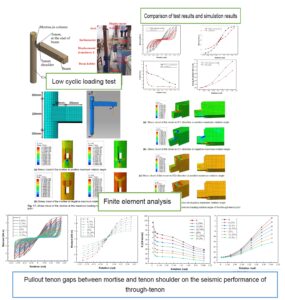
GRAPHICAL ABSTRACT

INTRODUCTION
As an important part of Chinese civilization, Chinese ancient building has its own unique architectural system. Usually, timber structure is the main load bearing system of Chinese ancient timber buildings, which is quite different from reinforced concrete structure. However, many ancient timber buildings were damaged and destroyed in earthquakes. Therefore, some researchers began to study seismic performance of ancient timber buildings. Xiong et al. (2013) investigated the damage situation of ancient timber buildings in the Lushan 7.0 earthquake, Sichuan. Xie et al. (2010) analyzed the earthquake damage situation of Chinese ancient buildings in the Wenchuan earthquake. They found that timber ancient buildings have good seismic performance. Timber structure has good isolation and energy dissipation ability. The mortise-tenon joint is a unique energy dissipation structure in timber structure (Ma et al. 2003). Research (Fang et al. 2001) has shown that mortise-tenon joints have semi-rigid character. On this basis, many scholars have conducted in-depth studies on the mechanical properties of mortise-tenon joints. Hu et al. (2020) established three types of mortise-tenon joint finite element models, which included a whole rigid model, a tie rigid model, and a semi-rigid model. The results showed that the semi-rigid model performed was the best. All these studies show that mortise and tenon joints are a key point of ancient timber buildings.
Ancient timber buildings have stood for hundreds of years. Many of them have survived many earthquakes. In the course of such events, different degrees of structural damage have occurred in the buildings, especially in the mortise and tenon joints. Therefore, many scholars have studied the reinforcement methods to improve the seismic performance of mortise-tenon joints. For example, Hu et al. (2023) proposed a novel method of enhancing the mechanical strength of the dovetail joint using a dowel reinforcement. Wang et al. (2021) investigated the in-plane rotational behavior and wood damage evolution of wood pegged semi mortise and tenon connections. Huan (2019) found that mortise and tenon joints retained semi-rigid characteristics after flat steel reinforcement. Seismic performance of the reinforced joints can be effectively improved. Xie et al. (2018) found that the residual deformation of the mortise-tenon joints strengthened with shape memory alloy is approximately 20% less than that strengthened with the conventional strengthening methods,such as cramp, carbon fiber, steel pins, U-shaped hoop, angle steel, curved plate, etc. Shi et al. (2022) studied the influence of six reinforcement methods such as nails on the seismic performance of mortise-tenon joints. Their studies provided a reference for the repair and seismic pre-reinforcement of similarly damaged timber structure buildings. However, these studies were focused on the reinforcement effect on healthy joints without considering the negative effect of structural damage on the joints.
There are many factors affecting seismic performance of mortise and tenon joints, such as the type of mortise and tenon joint, their geometry, and the type of reinforcement. Through-tenon joints, dovetail tenon joints, and half tenon joints are widely used in ancient buildings of large palaces, whereas continuous tenon joints are mostly used in traditional residential buildings. Chen and Qiu (2016), Chun et al. (2016), and Xu et al. (2021) respectively studied the mechanical properties of through-tenon joints and obtained its main failure modes, flexural behavior, bearing capacity, and other mechanical properties. Chen et al. (2016) obtained the moment-rotation curves and failure modes of through-tenon joints through tests and numerical simulation. Xie et al. (2016) investigated the force mechanism of a dovetail mortise-tenon joint and deduced the moment-rotation relationship according to the mechanical equilibrium and deformation coordination. In order to rationalize the dimensional design of mortise and tenon joints, some scholars investigated the effect of tenon geometric dimensions (length, width, and thickness) on withdrawal and bending load capacities of mortise-and-tenon (M-T) joints (Hu et al. 2021; Zhang and Hu 2021). The results of Xue’s (2019) study show that pinching effect of the moment-rotation hysteresis curves of continuous tenon joint becomes more obvious as the section height of Fang increases. Apart from these factors, damage has been found to affect the seismic performance of mortise-tenon joints (Sha et al. 2019). Inner gaps between mortise and tenon is a common form of structural damage. He (2021) investigated the mechanical performance of through-tenon joint involving gaps, and a theoretical model of the bending moment for a loose mortise-tenon joint was proposed. Yu (2022) studied the behavior of a wooden portal frame with through-tenon joints and column foot connections under transverse load. An analytical model for a planar loose through-tenon joint was proposed based on the load-displacement relationship. Results indicate that the lateral deflection mechanism of a wooden frame is strongly affected by the loose through-tenon joints and the P-Δ effect of the supporting columns. Hu (2022) analyzed the stress mechanism of a straight mortise-tenon joint with wooden pegs in traditional residential wooden structures. A theoretical moment-rotation model of the joint was derived, and the parameters of the theoretical model were analyzed. Yang et al. (2020) studied the load resisting mechanism of the mortise-tenon joint with gaps under in-plane forces and moments. Chang et al. (2022) investigated the seismic behavior of Gutou mortise-tenon joint under loose damage. Ogawa et al. (2016) derived a method of theoretical estimation with a gap as parameter for the mechanical performance of mortise-tenon joint. In addition, it experimentally validated the method of estimation and numerically analyzed the influence of a size of such gap on mechanical properties. The numerical analysis clarified the large influence of the gap at joints on the mechanical properties. Xue (2018) analyzed the force mechanism of the through-tenon joints, and the theoretical formulas of the moment-rotation angles of the joints with different loosening degrees were deduced. Research results show that the bearing capacity of the joint is reduced gradually with the increase of the looseness.
The gap between mortise and tenon shoulder is a common phenomenon of damage to mortise-tenon joints in post-earthquake ancient timber architecture (Li et al. 2022). Therefore, some scholars have studied the influence of the gap between mortise and tenon shoulder on the seismic performance of mortise-tenon joints. It can be found that most previous studies mainly focused on the seismic performance of mortise and tenon joints under non-destructive conditions. A minority of studies focused on the influence of gaps between surfaces of tenon and mortise on the seismic performance of joints. However, little research has been done to study the pullout tenon gaps between mortise and tenon shoulder. According to historical earthquake damage data by Xiong et al. (2013), the pullout tenon gaps between mortise and tenon shoulder is one of the main earthquake damage forms of ancient timber buildings. Xie et al. (2019) studied the cyclic behavior of straight mortise-tenon joints with pullout tenons. The results showed that the strength and deformation of a joint with a pulled-out tenon decreases with the increase of the pulled-out length. Yang et al. (2015) conducted a static test on the dovetail joint with the gap between mortise and tenon shoulder and analyzed the mechanical properties of the wooden frame in the damaged state. The main failure modes of the joints, the influence of the gap between mortise and tenon shoulder on the failure of the frame, the ultimate bearing capacity, and the value method of the ultimate load were obtained. Xu et al. (2014) studied the mechanical properties of through-tenon joints under the state of pull tenon, and the influence of the gap between mortise and tenon shoulder on the overall performance of the structure was obtained.
In this paper, the seismic performance of through-tenon joint was investigated by low-cycle loading tests. Finite element analysis was used to study the seismic performance of through-tenon joints. The finite element analysis results were compared with the test results to verify the reliability of the finite element analysis model. Based on the model, six finite element analysis models of through-tenon joint with different gaps were built. The seismic performance of these models was compared and analyzed.
EXPERIMENTAL
According to the building code published during the Song dynasty, Yingzao Fashi (Li 1950), a 1:3.52 scaled through-tenon joint model was fabricated. The tested timber structure consists of two main parts, column and beam. The dimensions of specimen are shown in Fig. 1. As Pinus sylvestris timber is a widely used material in construction and restoration of ancient timber structures, the model used in this test was made of Pinus sylvestris timber. The wood for test is sourced from northeast of China. Moisture content and air-dry density of the wood were 11% and 0.47 g/m3, respectively. Table 1 shows the mechanical parameters of wood material, and these parameters were also used in the finite element model, which were obtained from the previous studies (Meng et al. 2018).

Fig. 1. Dimensions and structure of through-tenon joint model. (a) Plan view of mortise and tenon joint (mm) (b) 3D view of mortise and tenon joint (L, R, and T are the longitudinal, radial, and tangential directions of timber)
All the specimens were handmade by carpenters. After the specimens were manufactured, they are transported to the test set. Some handmade devices are shown in Fig. 2.


Fig. 2. Handmade devices
Table 1. Mechanical Parameters Used in Finite Element Model

Loading Scheme
Tests were done according to the loading procedure in Building Seismic Test Regulations (JGJ/ T101-2015) (Wu 1997). A universal testing machine was used for loading, using the device shown in Fig. 3. Vertical displacement load was applied to the end of beam to make the tenon rotate until displacement reached the maximum range of the loading machine. Vertical upward loading was set as the negative loading direction, and the opposite was set as the positive loading direction. Control displacements were selected as ± 1, ± 3, ± 5, ± 10, ± 20, ± 30, ± 40, and ± 50 mm (1/700, 3/700, 1/140, 1/70, 1/35, 3/70, 2/35, and 1/14 rad, respectively). When the control displacement was 1 to 5 mm, the load speed was 1 mm/min, whereas when the control displacement was 10 to 50 mm, the load speed was 10 mm/min. Each displacement load was cycled three times. The loading procedure for the cyclic test is shown in Fig. 4. The loading position was 700 mm away from the shoulder of the tenon. According to the Ying Zao Fa Shi standard and scale factor, the computed roof weights were 4 kN. The loads were applied on the top of column by a hydraulic jack.

Fig. 3. Universal testing machine

Fig. 4. Loading procedure for the cyclic test
Measuring Scheme
The horizontal loads and displacements of specimen were collected automatically by the program system. Two displacement measuring instruments were set to the top and bottom surfaces of the beam to measure the tenon pullout length. An inclinometer was used to measure the rotation angle of the beam. The test setup is shown in Fig. 5.

Fig. 5. Test setup Fig. 6. Cracks and plastic deformation on the tenon
General Observations from the Test
No obvious damage was observed during the course of the initial loading procedure (the rotation angles between ±1/700 rad to ±1/70 rad). When the rotation angle was beyond 1/70 rad, the mortise and tenon began to rub and squeeze each other harder and harder. When the rotation angle reached ±3/70 rad, slightly plastic deformation occurred on the tenon. The specimen began to creak and groan while loading rotation angle continued to grow. At first, there was no gap between mortise and tenon shoulder. However, the gap became wider and wider while the loading displacements increased. At the end of test, the tenon was pulled out of the mortise at a length of about 5 mm. Cracks on the tenon were observed. Slight plastic deformation had occurred at the end of the tenon. Details are shown in Fig. 6.
Finite Element Model Using ABAQUS
ABAQUS is software that uses the finite element method to generate highly approximate solutions. ABAQUS was used in this study to analyze the seismic performance of through-tenon joints. Established finite element model is shown in Fig. 7. Mechanical properties of timber are characterized by anisotropy, which can be simplified as orthotropic materials. The ideal elastic-plastic model was used to simulate parallel to grain compression property of wood, and the bilinear strengthening model was used to simulate perpendicular to grain compression property of wood. Details are shown in Fig. 8. Mechanical properties of wood in elastic stage were defined by Engineering Constants module of ABAQUS. Initial yield ratios in every direction of the plastic stage of wood were defined by a potential function. The model takes the parallel to grain compressive strength as the reference yield strength, and sets the initial yield stress ratio R11, R22, R33, R12, R13, and R23 of timber in every direction as 1, 0.124, 0.111, 0.326, 0.326, and 0.326, respectively. These ratios can be calculated by the method from Zhu (2015) and Xue et al. (2019). Eight-node hexahedral linear reduced solid units (C3D8R) were selected to build finite element model. Contact mode between cells was set as surface-to-surface contact. There were normal and tangential forces between contact surfaces, and hard contact was adopted in normal contact. The analysis model allowed the tenon to separate from the column during revolution of the beam. Friction-slip between tenon and mortise was expressed by a penalty friction formula in tangential behavior. Some studies show that the coefficient of friction between surfaces of wood is about 0.5 (Hu et al. 2020). Xie et al. (2019) suggest that the coefficient of friction is between 0.1 and 0.6. However, some studies show the coefficient of sliding friction is smaller than that of static friction, and the direction of wood texture will affect the friction coefficient (Wang 2014). The sliding friction coefficient between wood surfaces along to the grain and perpendicular to the grain ranges from 0.3 to 0.4. (Wang 2014). Considering the size error between test model and finite analysis model, the tenon is easier to slip during the test. Therefore, set the coefficient friction to 0.3 in finite element model. The surfaces of mortise were set as master surfaces, and surfaces of tenon were set as slave surfaces. In order to avoid the master surface penetrating the slave surface, the mesh size of tenon near mortise-tenon joint contact surface was 10 mm, and the mesh size of the part away from contact surface was 20 mm. The mesh size of mortise was 20 mm, and the mesh size of the parts far from mortise was 30 mm. Meshing of finite element model is shown in Fig. 7(a).

Fig. 7. Finite element model. (a) Meshing of finite element model; (b) Boundary conditions and load

Fig. 8. The compressive stress-strain relationship. Double-linear constitutive model of timber (a) perpendicular to and; (b) parallel to the grain
Two reference points were set, one was 100 mm above the top surface, and another one was 100 mm below the bottom surface of the column and coupled with the top and bottom surfaces, respectively. The top of the column only releases the axial displacement constraint along the column height direction. The vertical load was 4 kN and applied on the top of the column as concentrated load. The bottom of column was constrained as fixed support constraint, which means the translation and rotational degrees of freedom of constraint in all directions were constrained. A coupling restraint point of beam was set at the bottom of the beam, which was 700 mm from the tenon. Set boundary conditions at the coupling point so that the beam end can move up and down and rotate around tenon. The same vertical cyclic loads were applied as in the loading procedure of cyclic test on the coupling restraint point. After the establishment and calculation of the finite element model, the force-displacement curves at the loading point could be exported through post-processing module. Boundary conditions and loading point are shown in Fig. 7(b).
RESULTS AND DISCUSSION
Finite Element Analysis and Test Results
Moment – rotation(M-φ) hysteresis curve
The moment-rotation (M-φ) hysteresis curve is the relation curve about the force and deformation of the structure or component under cyclic loads. Moment was obtained by multiplying the load applied on beam and the distance from column surface together. Rotation angle was obtained by dividing the vertical displacement of beam into the distance that vertical actuator to column surface. The moment-rotation (M-φ) hysteresis curve reflects the bearing capacity, stiffness degradation, deformation capacity, and energy dissipation capacity of a structure or component. It is an important indicator to study the seismic performance of structures. Hysteresis curves of finite element analysis and test results are shown in Fig. 9.

Fig. 9. Hysteresis curves of finite element analysis and test results
The hysteresis curves were Z shaped, and they showed an obvious “pinch effect”. The pinching effect of hysteresis curves of test results was more obvious than that of finite element analysis results. Hysteresis curves of test results are asymmetric and finite element result is slightly asymmetric. The main reason for this phenomenon is that there are gaps between the inner contact surfaces of tenon and mortise of the test specimen. In the natural growth and storage process of wood, defects are inevitable. (as shown in Fig. 10). The defects can be due to drying shrinkage caused by evaporation of water, natural cracks, and wood knots. These natural defects are very common and inevitable in ancient buildings. These unavoidable factors lead to an initial gap between tenon and mortise, which make the tenon and mortise not closely contacted. Details are shown in Fig. 11.

Fig. 10. Natural defects

Fig. 11. Initial gap between tenon and mortise
Figure 12 shows, at the initial loading process of test, the moment increases slowly while the rotation angle increases. This indicates that the tenon was slipping on the inner surfaces of mortise at the initial loading process. The gaps between the inner surfaces of mortise and tenon make the tenon more likely to slide. The test shows the greater the loading displacement, the tighter the components are squeezed and the smaller gaps between inner surfaces of mortise and tenon. As rotation angle continued to increase, the material did not fail, and bearing capacity continued to rise, which indicates that through-tenon joints have good bearing capacity and deformation capacity.
However, finite element analysis did not consider the initial gaps. Tenon and mortise in finite element model are completely in contact with each other. Therefore, at the initial loading process of finite model, the slide of tenon was smaller than that of test, and the calculated results are higher than test results. As loading displacement increased, the difference between test results and finite element analysis results decreased. From the whole loading process, the change trend of finite element analysis results and test results was consistent.

Fig. 12. Slip and friction marks

Fig. 13. Envelope curves of finite element analysis and test results
Envelope curve
The envelope curve is the curve that connects the peak points of each cycle of the M-φ hysteresis curve (Yao 2008). Envelope curves of finite element analysis and test results are shown in Fig. 13.
The envelope curves of the specimen in positive and negative directions were asymmetrical. In the positive direction, the moment values of finite element analysis results and test results increased with the increase of rotation angle at initial loading stage. The two curves had the same increasing trend. The finite element analysis results were slightly greater than the experimental result. When rotation angle was 1/35 rad, the error was the largest, and the simulation result was about twice the value of the test results. This is attributed to the size errors of test specimen and the gaps between tenon and mortise, which makes tenon more likely to slip. When rotation angle reaches 1/14, the tenon and mortise are squeezed tightly and there is little gap between them. Therefore, the simulated value is the closest to the test value. The error was about 9%. At the initial loading process, timber was in the elastic stage and the slope of the curve was relatively large. With the increase of rotation angle, timber entered the elastoplastic stage and the curve gradually flattened out.
However, the flattening trend of the test curve in a positive direction was not obvious. This is mainly because there were gaps between the inner surfaces of mortise and tenon in the test. Due to gravity, the gap between the bottom surface of the tenon and the mortise was larger than the gap between upper surface of tenon and mortise. Meanwhile, the contact area between the bottom of the tenon and the mortise was larger than that between the upper part of the tenon and the mortise. Therefore, when loading in the positive direction, the tenon is more likely to slip in the test. Then the moment and deformation of joint in the test is smaller than that of simulated model. The gap decreases while the rotation increases, and the test value gradually approaches the calculated value. This result is consistent with the study by Xue et al. (2018). Based on this, it can be reasonably predicted that the test curve will tend to flatten in the next stage.
Stiffness degradation
In the loading process, stiffness of the mortise-tenon joint degrades as the rotation angle and the number of load cycles increases. The curve of secant stiffness K is used to reflect the damage accumulation of each specimen under every level of cyclic loading process. The calculation is as follows (Xue et al. 2016),
 (1)
(1)
where Mi is the peak moment of 1st loading cycle; and φi is the corresponding rotation angle to Mi. Stiffness degradation curves of finite element analysis and test results are shown in Fig. 14.

Fig. 14. Stiffness degradation curves of finite element analysis and test results
Both curves show that the stiffness of finite element model and test specimen degraded while the loading rotation angle and cycles increased. The slopes of both curves grew rapidly before the loading rotation angle reached 1/140 rad, which indicates that the stiffness degradation was rapid. The trend of test results and finite element analysis results were consistent with each other. The stiffness of the test joint decreased rapidly after the rotation angle reached 1/140 rad and decreased slowly after the rotation reached 1/70 rad. However, after rotation angle reached 1/140 rad, the stiffness of finite element model tended to decrease at a uniform rate. The stiffness of finite element analysis results tended to decrease at a uniform speed. The main reason for this phenomenon is that there were gaps between the tenon and mortise in the experiment. In the process of cyclic loading, the tenon will slip in the mortise, resulting in a rapid reduction in stiffness of the joint. Finite element analysis and test results show stiffness of finite element model decreased by 59.2%, and the stiffness of test specimen decreased by 60.2%. The test results were in agreement with the finite element analysis results to a certain extent. Compared with other studies (Xie 2019; Xue 2021), the shapes and changing trends of all the research results were similar.
Energy dissipation
Energy dissipation capacity of mortise-tenon joint refers to the ability to dissipate seismic energy. The stage energy dissipation index was used to evaluate the energy dissipation capacity of mortise-tenon joint. The stage energy dissipation index is the average value of the sum area of hysteresis curves after 3 complete cycles under various displacement loading stages. The energy dissipation comparison graph is shown in Fig.15.

Fig. 15. Energy dissipation curves of Finite element analysis and test results
The energy dissipation capacity of finite element analysis results and test results exhibited the same trend; both curves showed a parabolic growth with the increase of rotation angle. When displacement load was maximum, the energy dissipation of finite element analysis results was 50% higher than that of test result. This is because there were natural defects and gaps in the joint in the test, which had a great influence on the test result. While the material and surface contact of finite element model were ideal, there were no gaps and flaws in finite element model. Therefore, there was a certain error between finite element analysis result and the test result. Xue et al. (2020) studied the seismic performance of straight-tenon joint, the shape and changing rules of energy dissipation curves are same with this study.
Stress analysis of the tenon
Figure 16 shows stress distribution on the tenon of finite element model at the maximum rotation angle. The upper surface of tenon is partially pulled out of the mortise when the rotation angle reaches the maximum positive number 1/14 rad. Figure 16 (a) shows that the upper surface of variable cross section of tenon is in tension state along parallel to grain. The maximum tensile stress is 27.25 MPa. The bottom surface of tenon, which is squeezed with the surface of mortise, is in the compressed state parallel to the grain. The maximum compressive stress was 31.6 MP. When the loading rotation angle reached the maximum negative number -1/14 rad, the lower surface of tenon was partially pulled out of the mortise. Figure 16(b) shows the upper surface of variable cross section of tenon, which was squeezed with the mortise, was in a compressed state parallel to the grain. The maximum compressive stress was 17.54 MPa. The bottom surface of the tenon was in a tension state along parallel to grain. The maximum tensile stress was 18.52 MPa. The tensile and compressive stress parallel to grain of the tenon did not reach the tensile and compressive strength of the timber. Compressive plastic deformation perpendicular to grain occurred on the neck of tenon, and the stress was mainly compression perpendicular to grain.

Fig. 16. Stress cloud of the tenon at the maximum loading rotation angle of the through-tenon joint
Figure 16(c) and (d) show that when the beam reached its maximum rotation angle, the stress in direction of S22 (perpendicular to grain) was compressive stress, distributed at the area of tenon neck. The maximum compressive stress was 13.79 MPa, which was greater than the compressive strength perpendicular to grain of Pinus sylvestris. This was the cause of plastic deformation in this area, which is consistent with the test phenomenon. At the same time, the elements adjacent to the squeezed area were stretched perpendicular to grain direction. This means that in the mortise and tenon squeezed area, the squeezed deformation of the compressed elements caused tensile deformation of the adjacent elements. This explains the buckling and deformation of the timber fibers at the neck of tenon. The details are shown in Fig. 6.
Stress analysis of the mortise
As shown in Fig. 17, when the beam is loaded to the maximum rotation angle, the stress on the column is mainly distributed around mortise area. During the loading process, the tenon and mortise squeeze each other, and the mortise is mainly in the compression state parallel to grain. As shown in Fig. 17(a), when the beam reaches the maximum positive rotation angle, the lower edge surface and the upper surface of the mortise are compressed parallel to grain. And the maximum compressive stress occurs on the lower surface of the mortise, which is 16.87 MPa. As shown in Fig. 17(b), when the beam reaches the maximum positive rotation angle, the mortise is mainly compressed at the lower surface and upper surface edge of mortise. The maximum compressive stress in the S11 direction is 20.31 MPa. Both do not reach the compressive strength limit parallel to grain direction of the timber. There is no obvious deformation in the elements of mortise, which is consistent with the test phenomenon (Fig. 18). Stress clouds of column in the S33 direction are shown in Fig. 17(a). It is shown that compressive stresses are distributed on both sides’ surfaces of the mortise. This is because when the edge of the mortise is compressed in parallel to grain direction, slight extrusion deformation takes place in the direction of perpendicular to grain. Because the compression elements expand along the radial direction, the elements next to the expanding elements are squeezed.

Fig. 17. Stress cloud of the mortise at the maximum loading rotation angle of the through-tenon joint

Fig. 18. The mortise after loading is completed
Seismic Performance Analysis of Through-Tenon Joints with Different Gaps Between Mortise and Tenon Shoulder
The next goal was to study the influence of through-tenon joints with different gaps between mortise and tenon shoulder. On the basis of the finite element model, six finite element analysis models of through-tenon joint with different gaps were established. For the purpose of describing the length of gap between mortise and tenon shoulder, R is defined as the degree of tenon pullout of a mortise-tenon joint, expressed as follows,
R= L’/L (2)
where L’ is the length of the gap between mortise and tenon shoulder, and L is the length of the tenon. From the Technical Specification for Maintenance and Strengthening of Wooden Structures of Ancient Buildings, the threshold value for damage to mortise-tenon joints in raised beam frames is R= 40%. When R is greater than 40%, the damaged mortise-tenon joints cannot be used normally and are on the verge of destruction. The length of the tenon at the test specimen is 160 mm. According to calculation, the damage threshold value of the specimen in the test is 64 mm. In this paper, R was chosen to be 0, 6.25%, 12.5%, 18.75%, 25%, 31.25% and 37.5%, corresponding to gaps of 0 mm, 10 mm, 20 mm, 30 mm, 40 mm, 50 mm, and 60 mm, respectively.
Hysteresis Curves of Through-tenon Joints with Different Gaps between Mortise and Tenon Shoulder
Figure 19 shows hysteresis curves of through-tenon joints with different gaps between mortise and tenon shoulder. They are all “Z” shaped and have varying degrees of “pinch effect”. Finite element analysis results show that the larger the gap, the smaller the bending moment. The reason for this phenomenon is that as the gap increases, the tenon and mortise contact area decreases, resulting in less friction force of the tenon and mortise contact surfaces. The hysteresis curve has a slight asymmetry. The value of bending moment during positive loading is slightly larger than the value of bending moment during negative loading. This is because the shape of tenon is asymmetrical. The bending moment still shows a rising trend when R reaches 31.25%, and the rotation angle is more than 1/14 rad, which indicates that the through-tenon joints have a good deformation capacity. The bending moment still shows a rising trend when R reaches 31.25% and the rotation angle is more than 1/14 rad, which indicates that the through-tenon joints have a good deformation capacity.

Fig. 19. Hysteresis curves of through-tenon joints with different gaps between mortise and tenon shoulder
Skeleton Curves of Through-tenon Joints with Different Gaps Between Mortise and Tenon Shoulder
Figure 20 shows skeleton curves of through-tenon joints with different gaps between mortise and tenon shoulder. The trend of the skeleton curves at each joint is basically the same. The curves all show two phases, the elastic stage and the plastic stage. At the initial stage of loading, the bending moment is in linear relationship with the rotation angle. The initial stiffness and bending moment values of the joints decrease with increasing R. As the rotation angle increases, the tenon and mortise are squeezed more tightly against each other. When the rotation angle reaches 3/70 rad, the slope of the skeleton curve gradually decreases and the stiffness of the joint decreases. At the same time, the plastic deformation of the joint increases, the tenon and mortise connection loosens, the skeleton curve starts to become flat, and the bending moment value remains relatively stable. When the gap length is 10, 20, 30, 40, 50, and 60 mm, the peak bending moment of the joint decreases by 9.8%, 22.6%, 32.2%, 42.9%, 53.7% and 64.5%, respectively, compared with that of no gap. For every 6.25% increase of R, the maximum bending moment value decreases by an average of 10.7%. Thus, a larger gap results in a smaller bending moment. At the same loading rotation angle, a larger gap results in a weaker joint energy dissipation capacity.

Fig. 20. Skeleton curves of through-tenon joints with different gaps between mortise and tenon shoulder
Degradation of Through-tenon Joints with Different Gaps Between Mortise and Tenon Shoulder
Figure 21 shows stiffness degradation curves of through-tenon joints with different gaps between mortise and tenon shoulder. The stiffness degradation law is the same for through-tenon joints with different gaps between mortise and tenon shoulder. As the rotation angle increases, the joint stiffness decreases. The stiffness decreases rapidly when the rotation angle is less than 1/200 rad. When the rotation angle is greater than 1/200rad, the rate of stiffness degradation decreases steadily. The larger gap between mortise and tenon shoulder results in slower stiffness degradation. Comparing the initial stiffness of joints with different gaps between mortise and tenon shoulder, the larger gap results in smaller initial stiffness of through-tenon joints. This is due to the smaller contact area of tenon and mortise, resulting in smaller friction on the contact surface, so the initial stiffness of the joint decreases. With a smaller contact area, less friction is created, reducing the initial stiffness of the joint. For every 6.25% increase of R, the initial stiffness of the through-tenon joint decreases by an average of 10.8% in the range of tenon joint damage threshold values.

Fig. 21. Stiffness degradation curves of through-tenon joints with different gaps between mortise and tenon shoulder
Energy Dissipation of Through-tenon Joints with Different Gaps between Mortise and Tenon Shoulder
Figure 22 shows energy dissipation curves of through-tenon joints with different gaps between mortise and tenon shoulder. There was a difference in changing law of energy dissipation curves for joints with different gaps between mortise and tenon shoulder. All curves can be divided into two stages. The first stage is a parabolic increase in the energy dissipation capacity of the joint at rotation angles less than 3/70 rad. The second stage is when the rotation angle is greater than 1/20 rad and the growth rate of the energy dissipation capacity of the joint is reduced. Comparison of mortise-tenon joints with different gaps between mortise and tenon shoulder shows that the larger the gap, the weaker the energy dissipation capacity of the joint at the same rotation angle. It can be seen that the gap between mortise and tenon shoulder has a significant effect on the energy dissipation capacity of through-tenon joints.
In summary, the gap between mortise and tenon shoulder of through-tenon joints has a negative effect on seismic performance. It has adverse effects in terms of the bending moment, deformation capacity, stiffness, and energy dissipation.

Fig. 22. Energy dissipation curves of through-tenon joints with different gaps between mortise and tenon shoulder
- Hysteresis curves of the through-tenon joints were “Z” shaped, and there was an obvious “pinch effect”. The hysteresis curve is asymmetrical. The main reasons for the “Z” shape and asymmetry of the hysteresis curve are that there are gaps between mortise and tenon, and the gaps between the top and bottom surfaces of the tenon and mortise surfaces are different. When the loading rotation angle is small, relative slipping and sliding friction occurred between the surfaces of mortise and tenon. Test results and finite element analysis results show no obvious damage occurred during the loading process, except some plastic deformations of timber. This indicates the through-tenon joint has high deformation and load-bearing capacity.
- Hysteresis curves of the finite element analysis of the through-tenon joint were consistent with the experimental results, they were all “Z” shaped. The errors between test and finite element analysis results mainly could be attributed to the material model used in finite element was somewhat different from the real timber used in the test. Material mechanical properties of timber are complicated, and it is hard to completely account for these details in the finite element simulation. All test specimens were handmade. There were size errors in test specimens, which resulted in gaps between mortise and tenon surfaces. However, the sizes of finite element model are completely accurate. This explains why the finite element analysis results were slightly bigger than the test results. Although there were some errors between finite element analysis results and test results, the changing trends were the same. The stress analysis based on finite element simulation shows the stress distribution and deformations of the finite element model were consistent with the test specimens. It indicates that the finite element analysis model and finite element analysis results are reliable.
- Finite element analysis results of through-tenon joints with different gaps between mortise and tenon shoulder showed that the larger the gap, the smaller the bending moment. At the same loading rotation angle, the larger the gap, the weaker the joint energy dissipation capacity. In actual ancient timber buildings, it is prohibitive to do any destructive tests and experiments on the original structure. Therefore, it is hard to evaluate the seismic performance of mortise and tenon joint with gaps. The present work studied the influence of gaps between mortise and tenon shoulder on seismic performance of the through-tenon joints. In addition, the errors between simulation results and test results were analyzed. The research results provide references for the evaluation of the seismic performance, such as hysteresis rule, bearing capacity, stiffness and energy dissipation capacity, of timber structure with gaps between mortise and tenon shoulder.
- In this study, the simulation results and test results shared the same changing trend and shape. There were errors between the simulation results and test results. An error analysis of the results was conducted. The error arose mainly because there were gaps between inner surfaces of mortise and tenon in the test specimen, while the joint was not loose in the finite element model. Compared with other studies on mortise and tenon joints, hysteresis curves, envelop curves, and energy dissipation curves of this study were similar to those obtained by other studies on mortise and tenon joints. However, the values in all studies are different. This is mainly ascribed to the fact that the wood material, sizes, and mortise and tenon joints are different.
ACKNOWLEDGMENTS
The authors are grateful for financial support from the Beijing Municipal Commission of Education-Municipal Natural Science Joint Foundation: “Research on Seismic Performance Evaluation of Beijing Ancient Timber Buildings Based on Value and damage Characteristics” (Grant No. KZ202010005012); the National Natural Science Foundation of China (Grant No. 52278472); Beijing Municipal Natural Science Foundation (Grant No.8232004)
REFERENCES CITED
Chang, P., Feng, Q. G., Han, L., and Yang, N. (2022). “Experimental study on seismic behavior of Gutou mortise-tenon joint under loose damage,” Journal of Building Structures 44(10), 86-96. DOI: 10.14006/j.jzjgxb.2022.0185
Chen, C. C., Qiu, H. X., and Lu, Y. (2016). “Flexural behaviour of timber dovetail mortise-tenon joints,” Construction and Building Materials 112(2016), 366-377. DOI: 10.1016/j.conbuildmat.2016.02.074
Chen, C. C., and Qiu, H. X. (2016). “Flexural behavior of penetrated mortise-tenon joints,” Journal of Southeast University (Natural Science Edition) 32(2),326-334. DOI: 10.3969/j.issn.1001-0505.2016.02.016
Chun, Q., Pan, J. W., and Dong, Y. (2016). “Research on mechanical properties of ban mortise-tenon joint of the traditional timber buildings in the South Yangtze River regions,” Journal of Hunan University (Natural Sciences) 51(5), 862-869. DOI: 10.3969/j.issn.0258-2724.2016.05.007
Fang, D. P., Iwasaki, S., Yu, M. H., Shen, Q. P., Miyamoto, Y., and Hikosaka, H. (2001). “Ancient Chinese timber architecture. I: Experimental study,” Journal of Structural Engineering 127(11), 1348-1357/ DOI: 10.1061/(ASCE)0733-9445(2001)127:11(1348).
He, J. X., Pan, Y., Wang, J., Yang, Q. S., Han, M., and Xie, L. L. (2021). “Theoretical model of bending moment for the penetrated mortise-tenon joint involving gaps in traditional timber structure,” Journal of Building Engineering 42(42). DOI: 10.1016 j.jobe.2021.10 102
Huan, J. H., Ma, D. H., Guo, X. D., and Xu, S. (2019). “Experimental study of aseismic behaviors of flexural tenon joint, through tenon joint and dovetail joint reinforced with flat steel devices,” Journal of Beijing University of Technology 45(08), 763-771. DOI: 10.11936 / bjutxb2018010012
Hu, B., Cai, J., and Yang, C. (2022). “Theoretical model of bending moment for straight mortise-and-tenon joints with wooden pegs involving a gap,” Materials (Basel, Switzerland) 15(5). DOI: 10.3390/ma15051835
Hu, W. G., and Chen, B. R. (2021). “A methodology for optimizing tenon geometry dimensions of mortise-and-tenon joint wood products.” Forests 12, article 478. DOI:10.3390/f12040478.
Hu, W. G., and Liu, N. (2020). “Comparisons of finite element models used to predict bending strength of mortise-and-tenon joints,” BioResources 15(3), 5801-5811. DOI: 10.15376/biores.15.3.5801-5811
Hu, W. G., and Liu, N. (2020). “Numerical and optimal study on bending moment capacity and stiffness of mortise-and-tenon joint for wood products,” Forests 11(5), article 501. DOI:10.3390/f11050501.
Hu, W. G., Luo, M. Y., Liu, Y. Q., Xu, W. and Arif, C. K. (2023). “Experimental and numerical studies on the mechanical properties and behaviors of a novel wood dowel reinforced dovetail joint,” Engineering Failure Analysis 152(2023), article 10744. DOI: 10.1016/j.engfailanal.2023.107440
Li, J. (1950). Yingzao Fashi (Construction method). Royal Press, Kaifeng, Chinese.
Li, Y. H., Yao, L. H., Guo, Y., Liu, R. G., Wu, Y. Q., Jia, H. L., Yu, X., Wang, C., Hu, Z. B., and Chen, C. (2022). “Comparative analysis on the mechanical properties of mortise-tenon joints in heritage timber buildings with and without a ‘Que-Ti’ component,” BioResources 17(3), 4116-4135. DOI: 10.15376/biores.17.3.4116-4135
Ma, B. J. (2003). Woodworking Techniques for Ancient Chinese Buildings, Science Publishers, Beijing, China.
Meng, X. J., Yang, Q. S., Wei, J. W., and Li, T. Y. (2018). “Experimental investigation on the lateral structural performance of a traditional Chinese pre-Ming dynasty timber structure based on half-scale pseudo-static tests,” Engineering Structures 167(2018), 582-591 DOI: 10.1016/j.engstruct.2018.04.077
Ogawa, K., Sasaki, Y., and Yamasaki, M. (2016). “Theoretical estimation of the mechanical performance of traditional mortise–tenon joint involving a gap,” Journal of Wood Science 62(3), 242-250. DOI: 10.1007/s10086-016-1544-9
Sha, B., Wang, H., and Li, A. (2019). “The influence of the damage of mortise-tenon joint on the cyclic performance of the traditional Chinese timber frame,” Applied Sciences 9(16), article 3429. DOI: 10.3390/app9163429
Shi, R. L., Xiong, J. L., Zhang, J., Shi, S. H., and Li, Q. L. (2022). “On strengthening of tenon-mortise joint of wood structure building based on ABAQUS: A case study of Guangming Village, Zhaotong City, Yunnan Province,” Journal of Hunan University of Science and Technology (Natural Science Edition) (002), 037. DOI: 0.13582/j.cnki.1672-9102.2022.02.006
Wang, D. (2014). Friction Energy Dissipation Mechanism and Mechanics Model Test on Tradition Wooden Structure Joint Region, Master’s Thesis, Kunming University of Science and Technology, Yunnan, China.
Wang, M. Q., Song, X. B., and Luo, L. (2021). “Experimental study and finite element analysis of rotational behavior of wood pegged semi mortise and tenon connections,” Journal of Building Structures 42(3), 193-201. DOI: 10.14006/j.jzjgxb.2019.0211
Wu, S. Y. (1997). “Regulations for seismic test methods for buildings,” (JGJ101-96) Introduction, Engineering seismic resistance.
Xie, Q. F., Du, B., Qian, C. Y., Zheng, P. J., and Zhang, F. L. (2016). “Study on the moment-rotation model of the dovetail mortise-tenon joint of ancient timber buildings,” Engineering Mechanics 33(08), 39-44. DOI: 10.6052/j.issn.1000-4750.2014.06.0558
Xie, Q. F., Xue, J. Y., and Zhao, H. T. (2010). “Seismic damage investigation and analysis of ancient buildings in Wenchuan earthquake,” Journal of Building Structures 31(S2), 18-23. DOI: 10.14006/j.jzjgxb.2010.s 2.049.
Xie, Q. F., Zhang, L. P., Wang, L., Cui, Y. Z., and Yang, L. J. (2019). “Finite element analysis on the cyclic of straight mortise-tenon joints with pullout tenons,” Engineering Mechanics 36(S1), 138-143. DOI: 10.6052/j.issn.1000-4750.2018.04.S024
Xie, Q. F., Zhang, L. P., Zhou, W. J. (2018). “Cyclical behavior of timber mortise-tenon joints strengthened with shape memory alloy: Experiments and moment-rotation model,” International Journal of Architectural Heritage 13(8), 1209-1222. DOI: 10.1080/15583058.2018.1501116
Xiong, L. H., Lan, R. Q., Wang, Y. M., Tian, X. M., and Feng, B. (2013). “Earthquake damage investigation of structures in 7.0 Lushan strong earthquake,” Journal of Earthquake Engineering and Engineering Vibration 33(04), 35-43. DOI: 10.11810/1000-1301.20130405
Xue, J. Y., Li, Y. Z., and Xia, H. L. (2016). “Experimental study on seismic performance of dovetail joints with different loose degrees in ancient buildings,” Journal of Building Structures 37(4), 73-79. DOI: 10.14006/j.jzjgxb.2016.04.010
Xue, J. Y., Wu, C. W., Zhang X. C., and Qi, Z. D. (2020). “Experimental and numerical analysis on seismic performance of straight-tenon joints reinforced with friction damper,” Structural Control and Health Monitoring 27(10), article e2613. DOI: 10.1002/stc.2613.
Xue, J. Y., Qi, L. J., Dong, J. S., and Xu, D. (2018). “Analytical investigation on moment-rotation relationship of through-tenon joints with looseness in ancient timber buildings,” Earthquakes and Structures 14(3)241-248. DOI: 10.12989/eas.2018.14.3.241
Xue, J. Y., Xu, D., and Dai, W. Q. (2019). “Experimental study and numerical simulation analysis on seismic performance of continuous tenon joint in column-and-tie timber structure,” China Civil Engineering Journal 52(11), 56-65. DOI: 10.15951/j.tmgcxb.2019.11.006
Xu, T., Zhang, Y. M., and Song, X. S. (2014). “Experimental study on dovetail joint in historic timber buildings under the state of out of mortise,” Journal of Hebei United University (Natural Science Edition) 36(01), 92-96.
Xu, J., Zhu, Z. Y., Liang, W., Zou, Z. Y., Zhai, S. N., and Yuan, S. C. (2021). “Study on seismic behavior of the mortise-tenon joint of Chuan-Dou type timber frames of Guihe building in Wuhou shrine,” Earthquake Engineering and Engineering Dynamics 41(1), 140-150. DOI: 10.13197/j.eeev.2021.01.140.xuj.017
Yao, Q. F. (2008). Structural Testing in Civil Engineering, China Architecture & Building Press, Beijing, China.
Yang, Q. S., Pan, Y., and Law, S. S. (2020). “Load resisting mechanism of the mortise-tenon connection with gaps under in-plane forces and moments,” Engineering Structures 219, article 110755. DOI: 10.1016/j.engstruct.2020.110755
Yang, X., Guo, X. D., Wu, Y., Huang, R. Q. (2015). “Experimental study of dovetail joints in timber structures of ancient buildings based on tenon pullout condition,” Sciences of Conservation and Archaeology 27(1), 54-58. DOI: 10.3969/j.issn.1005-1538.2015.01.008
Yu, P., Yang, Q. S., and Law, S. S. (2022). “Lateral performances of traditional wooden frame with loose penetrated mortise-tenon connection and column foot models,” Journal of Building Engineering 47(47), article 103793. DOI: 10.1016/j.jobe.2021.103793
Zhang, T. X., and Hu, W. G. (2021). “Numerical study on effects of tenon sizes on withdrawal load capacity of mortise and tenon joint,” Wood Research 66(2), 321-330. DOI: 10.37763/wr.136-4561/66.2.321330
Zhu, Z. M. (2015). Experimental Research on Mechanical Properties of Timber Structural Members with Shrinkage Cracks in Historic Buildings, Master’s Thesis, Southeast University, Jiangsu, China.
Article submitted: August 2, 2023; Peer review completed: October 14, 2023; Revised version received and accepted: November 9, 2023; Published: November 16, 2023.
DOI: 10.15376/biores.19.1.322-344