
Abstract
Carbon quantum dots (CQDs) with good water solubility and fluorescence properties were successfully synthesized from Chenopodium quinoa Willd. straw, a biomass by-product, by a one-step carbonization method. Structural characterization of the fabricated carbon quantum dots by Fourier transform infrared spectroscopy (FT-IR) demonstrated the presence of a large number of functional groups on the surface of the carbon quantum dots, which gives them good water solubility. The synthesized carbon quantum dots were characterized optically by ultraviolet-visible absorption spectroscopy (UV-Vis), photoluminescence spectroscopy (PL), and other analytical tools. Results indicate the addition of alkali metal ions gave a different degree of promotion of fluorescence intensity (Li+>Cs+>K+>Na+>Rb+), and according to this feature carbon quantum dots can be used as a new means of alkali metal ion detection.
Download PDF
Full Article
Synthesis of Carbon Quantum Dots Based on Quinoa Straw and their Application in Alkali Metal Ions Detection
Ye Xing, Ya-nan Wang, and Haichao Li *
Carbon quantum dots (CQDs) with good water solubility and fluorescence properties were successfully synthesized from Chenopodium quinoa Willd. straw, a biomass by-product, by a one-step carbonization method. Structural characterization of the fabricated carbon quantum dots by Fourier transform infrared spectroscopy (FT-IR) demonstrated the presence of a large number of functional groups on the surface of the carbon quantum dots, which gives them good water solubility. The synthesized carbon quantum dots were characterized optically by ultraviolet-visible absorption spectroscopy (UV-Vis), photoluminescence spectroscopy (PL), and other analytical tools. Results indicate the addition of alkali metal ions gave a different degree of promotion of fluorescence intensity (Li+>Cs+>K+>Na+>Rb+), and according to this feature carbon quantum dots can be used as a new means of alkali metal ion detection.
DOI: 10.15376/biores.19.2.3319-3327
Keywords: Chenopodium quinoa Willd.; Carbon quantum dots; Green preparation; Photoluminescence
Contact information: Key Laboratory of Applied Physical Chemistry of Qinghai Province, Qinghai Minzu University, Xining 810007, Qinghai, China; *Corresponding author: lihaichao@vip.163.com
GRAPHICAL ABSTRACT

INTRODUCTION
China is the largest producer of agricultural straw, and the total annual production of agricultural straw will be no less than 800 million tons (Bi et al. 2009), of which about 32.3% becomes heating fuel, about 27.1% of edible straw can be used as a source of roughage in livestock feed mixes, and about 14.1% is returned to the soil through decomposition (Yang et al. 2015; Yuan et al. 2015). With the pursuit of a healthy diet, the value of Chenopodium quinoa Willd. is gradually being discovered (Neha et al. 2023). Chenopodium quinoa has been widely cultivated in the high-altitude provinces of Qinghai and Gansu in northwestern China; it cannot be directly consumed by livestock due to the hardness of the straw without ensilage (Zhao et al. 2020). Most straw is burned directly, which causes air pollution and contributes to the greenhouse effect. Due to the lack of decomposers in the soils of the Tibetan Plateau region, straw remaining in the land can affect the following year’s cultivation (Fan et al. 2021; Guo and Zhao 2021). After testing, quinoa straw contained 46.3% cellulose, 11.6% hemicellulose, 7.53 lignin, and less ash. Compared to wheat straw and corn stover, quinoa straw has a higher cellulose content and a lower lignin content (Yang et al. 2022). Chenopodium quinoa straw is highly productive, widely available, and cheap. Thus, it can be used as a renewable industrial material.
Carbon quantum dots (CQDs) have received great academic attention since their discovery in 2004, and quantum dot research has once again received even wider attention when scientists in the field of quantum dots won the Nobel Prize for Chemistry in 2023 (Mohammad et al. 2019; Sanderson and Castelvecchi 2023). Compared with inorganic quantum dots, CQDs are free of heavy metals and have advantages in terms of high solubility, chemical stability, low biotoxicity, high biocompatibility, easy modification, and high resistance to photobleaching (Baweja and Jeet 2019; Manikandan and Lee 2022). These properties have been widely used in fluorescent probes, light-emitting diodes (LEDs), drug delivery, storage devices and thermal catalysts, and they have a wide range of potential applications in the materials field (Yuan et al. 2016; Tayyebeh et al. 2017; Wen et al. 2020; Gao et al. 2022). Various methods exist for the synthesis of CQDs, including laser ablation, electrochemical methods, hydrothermal methods, chemical oxidation methods, microwave, and ultrasonic methods (Thambiraj and Ravi 2016). However, these methods suffer from cumbersome preparation routes and demanding reaction conditions. In the past, the raw materials for the preparation of CQDs were usually synthesized from edible materials such as barley, milk, and potatoes, resulting in a waste of resources. Therefore, it is necessary to develop a green, efficient synthesis route for CQDs.
The development of Chenopodium quinoa Willd. straw multi-purpose utilization has positive significance in promoting environmental protection, energy security and farmers’ income in the highland area. In this paper, a one-step carbonization method was developed to successfully synthesize blue CQDs with good water solubility and photostability using quinoa straw, an agricultural by-product, as a carbon source. Compared to previous sources for the preparation of CQDs, quinoa straw has stronger economic benefits. A new method for alkali metal ion detection was developed based on the fact that different alkali metal ions have obvious fluorescence enhancement effects on the synthesized CQDs. Fluorescence testing does not require complex testing equipment and is inexpensive compared to traditional testing methods.
EXPERIMENTAL
Materials
Chenopodium quinoa Willd. straw was collected from cultivated land in Qinghai Province, China. Lithium chloride (LiCl), sodium chloride (NaCl), potassium chloride (KCl), rubidium chloride (RbCl), and cesium chloride (CsCl) were purchased from Shanghai Aladdin Biochemical Science and Technology Co., Ltd. All reagents were analytically pure and were directly without special treatment.
Preparation of the CQDs
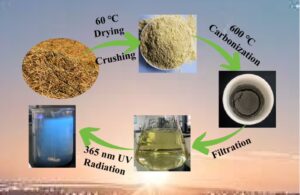
Chenopodium quinoa straw taken from cultivated land was first dried in a convection oven for 12 h and then crushed in a pulverizer to 200 mesh through a sieve. Taking 10 g of powder in a crucible, water was added over the powder. The crucible was placed in a drying oven to dry most of the water to brown-yellow cake, and then it was placed in a muffle furnace at 10 ℃/min to 600 ℃ and held at that temperature for 1 h. The powder was dried to evaporate most of the water, yielding a brown-yellow pie-shaped solid. After cooling to room temperature, the mixture was milled, filtered using a 0.22 μm filter membrane to remove large pieces of inaccessible activated carbon, and freeze-dried to obtain CQDs powder at a yield of 13.25%. The CQDs powder was then dissolved in deionized water and dialyzed in a dialysis bag (relative molecular mass 3,500) for 48 h (Zhao et al. 2020). The purified aqueous solution of CQDs obtained was used for subsequent experiments and characterization.
Characterization Methods
The microstructural features of the CQDs solutions were observed using a JEM-F200 transmission electron microscope (TEM) from JEOL Electronics, Japan. An appropriate amount of CQDs solution was dropped on a 300-mesh copper mesh with a collodion film and dried at room temperature. XRD tests were performed using an XRD-7000 diffractometer from SHIMADZU, Japan. The diffraction angle range was 2θ=10 to 80°, and the diffraction scan rate was 4°/min. The final diffraction spectra obtained were used to characterize the CQDs and determine their microcrystalline structure. Thermo Fisher DxR was used for Raman determination. Raman spectra of CQDs were obtained at an excitation wavelength of 532 nm, and Raman detection can obtain the degree of graphitization of carbon materials. The results can be used as a complement to the XRD results. The CQDs powder was mixed and ground with KBr powder and then pressed into discs, which were examined by FTIR using Thermo Fisher NICOLET IS20, USA. The infrared spectra were obtained by scanning in the wavelength range of 4000 to 1000 cm-1, and the functional groups of CQDs were analyzed by infrared spectroscopy. The optical properties of CQDs were characterized by UV spectroscopy and photoluminescence spectroscopy (PL). PL scans were performed with a Gangdong Science & Technology Development Co. F-320 device, China. The detection conditions of the fluorescence spectrophotometer were set to 10 nm slit widths for both excitation and emission wavelengths, and a photomultiplier voltage of 800 V during the detection process. UV spectra were measured by T600 UV-Vis Spectrophotometer, Beijing Purkinje GENERAL Instrument Co., Ltd., China. All experiments were repeated three times, and the results were averaged.
Detection of Fluorescence Process
Deionized water was selected as the standard solution, and the excitation wavelength of the mother liquors was measured at 240 to 500 nm with an excitation interval of 20 nm to obtain a maximum excitation wavelength of 320 nm. The mother liquors were configured into standard solutions containing LiCl, NaCl, KCl, RbCl, and CsCl with a mass fraction of 10 g/L. The maximum excitation wavelength was selected as the excitation wavelength and the intensity of the emitted light was measured for each solution.
RESULTS AND DISCUSSION
Characterization of the CQDs Structural
The CQDs synthesized by the one-step carbonation method showed a yellowish transparent solution in daylight, indicating that the CQDs had been successfully dissolved in the solution. The CQD solution showed a bright blue fluorescence under 365 nm UV light, indicating the presence of CQDs in the filtrate. The synthesis process is in line with the green production process, the production process is safe, the production equipment is simple, and it can be accomplished by regulating a single factor, which has the prospect of further large-scale synthesis.
Figure 1(a) shows a TEM image of CQDs, indicating that the prepared CQDs can be uniformly dispersed in solution as nearly spherical nanoparticles. The CQDs particles ranged from 0.8 to 2.5 nm, and the particle size are mainly distributed as 1.7 nm. The lattice stripes were obvious, indicating that the degree of graphitization had been possessed, and the lattice spacing was about 0.4 nm, which indicates that the prepared CQDs were amorphous graphite. All of the above microscopic morphologies met the definition of CQDs, indicating that CQDs had been successfully prepared. Figure 1(b) shows the XRD spectrum of the prepared CQDs, (002) crystal surface at 2θ about 26°. No other crystallographic Bragg peaks were found, which is typical of amorphous carbon features. The diffraction peaks on the (002) crystal faces were broad, indicating a low degree of graphitization and the presence of a large amount of amorphous carbon. The d002 graphite layer spacing was calculated to be 3.78 nm by Bragg’s formula, which roughly matches the graphite layer spacing observed by TEM.
The functional groups present on the surface of CQDs were investigated using FT-IR, and the results are shown in Fig. 1(c). The FT-IR spectra of the CQDs indicate that the broad absorption peak at 3412 cm-1 corresponds to the stretching vibration of the -OH/-NH2 group. The bands at 2984 and 2878 cm-1 correspond to C-H stretching vibrations, which may arise due to methyl or methylene groups associated with aliphatic hydrocarbons (Yang et al. 2022). The 2516 cm-1 absorption peak corresponds to the stretching vibrational mode of mercapto -SH. The 1799 cm-1 absorption peak corresponds to the stretching vibrational mode of C=O in carboxylic acids and carbonyls. The larger peak at 1426 cm-1 corresponds to the C=C stretching vibration. A distinct C-O/C-O-C stretching vibration was also observed at 1008 cm-1 which corresponds to the presence of epoxy groups (Thota et al. 2023).

Fig. 1. (a) TEM, (b) XRD and (c) FT-IR spectra of CQDs
Optical Properties of CQDs
The UV-vis absorption spectra show characteristic bands associated with the prepared CQDs. The CQDs exhibited absorbance bands in the range of 260 to 320 nm, attributed to the π-π* leaps of the C=C bond with sp2 hybridization; there was a weak shoulder at 270 to 400 nm, which can be attributed to the δ-π* of the C=O bond, with a tail that extends into the visible light (Shaari et al. 2021). Figure 2(a) shows the UV-vis spectra of CQDs, which show strong optical absorption in the UV region (Lin et al. 2019). The CQDs show two strong absorbances at 205 nm and 216 nm due to the π-π* leaps of the C=C bond. The presence of a shoulder peak at 234 nm is observed, which is due to the π-π* jump of the sp2 hybridization (Kalanidhi et al. 2022). Different sizes of CQDs have different emission and excitation wavelengths due to the different sizes of synthesized CQDs and different fluorescence intensities. Figure 2(b) shows the emission spectra of CQDs solutions at different excitation wavelengths, from which the optimal excitation and emission wavelengths of CQDs were 320 nm and 416 nm, respectively. CQDs luminescence is dependent on the excitation wavelength. The excitation wavelength redshifted emission wavelength was also redshifted, i.e., with the excitation wavelength redshifted, the fluorescence intensity showed a tendency to increase to the maximum excitation wavelength first and then to decrease. This may be due to the inhomogeneous particle size distribution of CQDs (Shaari et al. 2021).

Fig. 2. (a) Absorbance, maximum excitation and emission spectra of CQDs (b) Emission spectra of CQDs at different excitation wavelengths
Effect of Alkali Metal Ions on the Sensing Properties of CQDs
Figure 3 shows the fluorescence spectra with the addition of different alkali metal ions. The fluorescence intensity of CQDs is promoted by different alkali metal ions, and the fluorescence intensity after the addition of alkali metal ions was in the order of Li+>Cs+>K+>Na+>Rb+ from large to small. This may be due to the action of alkali metal ions on the surface of CQDs, which causes defects on the surface of CQDs or changes the electronic configuration of the surface of CQDs, increasing the band gap jump caused by π-electron conjugation, resulting in the change of the surface state of the CQDs, which suggests that the prepared CQDs can be tuned to modulate the luminescence intensity by adding different alkali metal ions (Isobe et al. 2019). At the maximum excitation wavelength, most of the alkali metal ions did not shift the maximum excitation wavelength of the CQDs. Contrary results were observed for Li+, which blueshifted the emission wavelength. This may be due to the fact that Li+ has an exceptionally small radius, resulting in a large ionic potential, which is significantly different from other alkali metals of the same main group. The addition of Li+ changes the charge distribution in the CQDs, resulting in a shift of the fluorescence emission peaks in the short-wave direction (Aoki et al. 2005). The feature that CQDs have different luminescence intensities when alkali metal ions are added makes CQDs applicable to the detection of alkali metal ions in solution by comparison with standard solutions.

Fig. 3. Fluorescence spectra of CQDs after addition of different alkali metal ions
Effect of UV Lamp Irradiation Duration on Fluorescence Intensity
The photostability of fluorophores is a very important property that determines the feasibility of biological applications. The fluorescence intensity of the CQDs decreased significantly with the increase of UV irradiation time by dark box four-use UV analyzer under 365 nm UV lamp irradiation, as shown in Fig. 4. The relative fluorescence intensity decreased by 5.2% during 100 min of UV irradiation, which indicates that the prepared carbon dots had obvious photostability in aqueous solution. Long time radiation of UV light can lead to fluorescence quenching of CQDs. UV light radiation promotes the excited state molecules to interact with other molecules and cause collisions, which in turn leads to fluorescence quenching (Xiao et al. 2022). At the same time, there is a positive correlation between light duration and luminous intensity, a property that makes it widely useful for inferring operating time.

Fig. 4. Effect of UV irradiation time on luminescence intensity
CONCLUSIONS
- A simple, green, and promising route for the synthesis of carbon quantum dots (CQDs) with one-step large-scale synthesis was developed using quinoa straw, an agricultural waste, as a carbon source. The prepared CQDs exhibited an amorphous structure, nearly spherical, with good water solubility, and abundant water-soluble functional groups on the surface such as -OH, -NH2, and C=C.
- The optimal excitation and emission wavelengths of the prepared CQDs were 320 nm and 416 nm, respectively. The fluorescence intensity was dependent on the excitation wavelength. The excitation wavelength was red-shifted, and the emission wavelength was likewise red-shifted. The fluorescence intensity was shown to increase to the maximal excitation wavelength firstly, and then decrease.
- Different alkali metal ions exhibited an obvious promotion of the luminescence intensity of the prepared CQDs. According to the different alkali metal ions on the CQDs. Different alkali metal ions on the CQDs affected the luminescence intensity in different ways, so that the CQDs can be used in the detection of alkali metal ions. This field has great potential for development. Under the irradiation of 365 nm UV lamp, the CQDs displayed obvious photostability, and the relative luminous intensity only decreased by 5.2% within 100 min.
ACKNOWLEDGMENTS
The authors are grateful for the support of the Key R&D and Transformation Program of Qinghai (2022-QY-210).
REFERENCES CITED
Aoki, K., Kawaguchi, T., and Ohta, K. (2005). “The largest blueshifts of the [O III] emission line in two narrow-line quasars,” Astrophysical J. 618, article 601. DOI: 10.1086/426075
Baweja, H., and Jeet, K. (2019). “Economical and green synthesis of graphene and carbon quantum dots from agricultural waste,” Mater Res Express 6(8), article 085098. DOI: 10.1088/2053-1591/ab28e5
Bi, Y. Y., Gao, C. Y., Wang, Y. J., and Lin, B. Y. (2009). “Estimation of straw resources in China,” Transactions of the Chinese Society of Agricultural Engineering 25, 211-217. DOI: 10.3969/j.issn.1002-6819.2009.12.037
Fan, J. H., Liu T. Y., Liao Y., Li Y. Y., Yan, Y., and Lu, X. Y. (2021). “Distinguishing stoichiometric homeostasis of soil microbial biomass in alpine grassland ecosystems: Evidence from 5,000 km belt transect across Qinghai–Tibet plateau,” Front. Plant Sci. 12, article 781695. DOI: 10.3389/fpls.2021.781695
Gao, W. L., Yin Q. F., Meng, X., He, X. L., and Xin, Z. (2022). “Excellent behaviors of highly dispersed Ni-based catalyst in CO methanation synthesized by in-situ hydrothermal method with carbon quantum dots assisted,” Fuel 310, article 121813. DOI: 10.1016/j.fuel.2021.121813
Guo, L., and Zhao, J. (2021). “Effect of burning straw in rural areas on ecological environment quality,” Arab. J. Geosci. 14, article 1357. DOI:10.1007/s12517-021-07797-7
Isobe, K., Nakajima, E., Morita, N., Kawakura, S., and Higo, M. (2019). “Effects of NaCl on growth and cesium absorption in quinoa (Chenopodium quinoa Willd.),” Water Air Soil Pollut. 230, article 66. DOI: 10.1007/s11270-019-4120-2
Kalanidhi, K., Bharathi, M. V., and Nagaraaj, P. (2022). “A green approach for synthesis of highly fluorescent carbon dots from waste engine oil: A strategy for waste to value added products,” Diam. Relat. Mater. 121, article 108724. DOI: 10.1016/j.diamond.2021.108724
Lin, X. X., Su, J. L., Lin, H. G., Sun, X. Y., Liu, B., Kankala, R. K., and Zhou, S. F. (2019). “Luminescent carbon nanodots based aptasensors for rapid detection of kanamycin residue,” Talanta 202, 452-459. DOI: 10.1016/j.talanta.2019.04.075
Manikandan, V., and Lee, N. Y. (2022). “Green synthesis of carbon quantum dots and their environmental applications,” Environ Res 212, article 113283. DOI: 10.1016/j.envres.2022.113283
Mohammad, J. M. (2019). “Carbon quantum dots and their biomedical and therapeutic applications: A review,” RSC Adv 9(12), 6460-6481. DOI: 10.1039/C8RA08088G
Neha, C., Swati, W., and Rakesh, K. (2023). “Functional composition, physiological effect and agronomy of future food quinoa (Chenopodium quinoa Willd.): A review,” J Food Compost Anal 118, article 105192. DOI: 10.1016/j.jfca.2023.105192
Sanderson, K., and Castelvecchi, D. (2023). “Tiny ‘quantum dot’ particles win chemistry Nobel,” Nature 622(7982), 227-228. DOI: 10.1038/d41586-023-03048-9
Shaari, N., Kamarudin, S. K., and Bahru, R. (2021) “Carbon and graphene quantum dots in fuel cell application: An overview,” Int. J. Energy Res. 45(2), 1396-1424. DOI: 10.1002/er.5889
Tayyebeh, M., Somayeh, M., Sahar, G., and Abbas, A. (2017). “Turn-off fluorescence of amino-functionalized carbon quantum dots as effective fluorescent probes for determination of isotretinoin,” Sens. Actuators B Chem. 247, 428-435. DOI: 10.1016/j.snb.2017.03.071
Thambiraj, S., and Ravi, S. D. (2016). “Green synthesis of highly fluorescent carbon quantum dots from sugarcane bagasse pulp,” Appl. Surf. Sci. 390, 435-443. DOI: 10.1016/j.apsusc.2016.08.106
Thota, S. P., Kolli, N. K., Kurdekar, A., Thota, S. M., Vadlani, P. V., and Kumar, B. S. (2023). “One-step synthesis of biocompatible luminescent carbon dots from Cuscuta for bio-imaging application,” Biomass Conv. Bioref. DOI: 10.1007/s13399-023-05211-8
Wen, S., Guo, R. H., Yuan, F. L., Li, Y. C., Li, X. H., Zhang, Y., Zhou, S. X., Fan, L. Z. (2020). “Red-emissive carbon quantum dots for nuclear drug delivery in cancer stem cells,” J. Phys. Chem. Lett. 11(4), 1357-1363. DOI: 10.1021/acs.jpclett.9b03891
Xiao, X. Z., Zhang Y. M., Zhou L., Li B., and Gu L. (2022). “Photoluminescence and fluorescence quenching of graphene oxide: A review,” Nanomaterials 12(14): article 2444. DOI: 10.3390/nano12142444
Yang, H., Xu, M., Koide, R. T., Liu, Q., Dai, Y., Liu, L., and Bian, X. (2015). “Effects of ditch-buried straw return on water percolation, nitrogen leaching and crop yields in a rice–wheat rotation system,” J. Sci. Food Agric. 96(4), 1141-1149. DOI: 10.1002/jsfa.7196
Yang, J. L., Guo, Z. J., and Yue X. T. (2022). “Preparation of carbon quantum dots from corn straw and their application in Cu2+ detection,” BioResources 17(1), 604-615. DOI: 10.15376/biores.17.1.604-615
Yuan, F., Wang, Z., Li, X., Li, Y., Tan, Z., Fan, L., and Yang, S. (2016). “Bright multicolor bandgap fluorescent carbon quantum dots for electroluminescent light emitting diodes,” Adv. Mater. 36, article 2312060. DOI: 10.1002/adma.201604436
Yuan, M., Zhong, R., Gao, H., Li, W., Yun, X., Liu, J., Zhao, X., Zhao, G., and Zhang, F. (2015). “One-step, green and economic synthesis of water-soluble photoluminescent carbon dots by hydrothermal treatment of wheat straw and their bio-applications in labeling, imaging and sensing,” Appl. Surf. Sci. 355, 1136-1144. DOI: 10.1016/j.apsusc.2015.07.095
Zhao, X. L., Wang, F., Fang, Y., Zhou, D.W., Wang, S.P., Wu D.Q., Wang, L.X., and Zhong, R. Z. (2020). “High-potency white-rot fungal strains and duration of fermentation to optimize corn straw as ruminant feed,” Bioresour. Technol. 312, article 123512. DOI: 10.1016/j.biortech.2020.123512
Article submitted: February 27, 2024; Peer review completed: March 23, 2024; Revised version received: March 26, 2024; Accepted: April 7, 2024; Published: April 12, 2024.
DOI: 10.15376/biores.19.2.3319-3327