
Abstract
Wall heating is an alternative method for residential heating that is used in a limited part of Europe. The goal of this study was to show the feasibility of this method for the Nordic market and to provide a comprehensive picture of wall heating and its functionality compared to traditional methods, i.e. radiators and floor heating. The study was conducted using a literature review, calculations, and a survey. Simulations were made using the computer software EnergyPlus (US Department of Energy). Results showed that placement of wall heating panels in interior walls results in a lower heat loss than placement in outer walls, and that wall heating can have equal or better energy-efficiency compared to floor heating and conventional radiators. Wall heating provides a more comfortable indoor climate, in regard to dust allergies, and there is no need to remove air from each individual heating panel. A disadvantage is the need for hidden installation, which creates a problem for a safe water installation and difficulties in the attachment of fixtures. Also, the wall heating system has difficultly in handling cold drafts. Though wall heating could compete with floor heating and radiators, its disadvantages are sufficient to explain why the system is not yet used in Sweden.
Download PDF
Full Article
Wall Heating – An Energy Efficient Solution for Wooden Buildings?
Jonas Turesson,a Xiaodong (Alice) Wang,a,* and Anders Gustafsson b
Wall heating is an alternative method for residential heating that is used in a limited part of Europe. The goal of this study was to show the feasibility of this method for the Nordic market and to provide a comprehensive picture of wall heating and its functionality compared to traditional methods, i.e. radiators and floor heating. The study was conducted using a literature review, calculations, and a survey. Simulations were made using the computer software EnergyPlus (US Department of Energy). Results showed that placement of wall heating panels in interior walls results in a lower heat loss than placement in outer walls, and that wall heating can have equal or better energy-efficiency compared to floor heating and conventional radiators. Wall heating provides a more comfortable indoor climate, in regard to dust allergies, and there is no need to remove air from each individual heating panel. A disadvantage is the need for hidden installation, which creates a problem for a safe water installation and difficulties in the attachment of fixtures. Also, the wall heating system has difficultly in handling cold drafts. Though wall heating could compete with floor heating and radiators, its disadvantages are sufficient to explain why the system is not yet used in Sweden.
Keywords: Wall heating; Energy efficient; Alternative method; Indoor climate
Contact information: a: Wood Technology and Engineering, Luleå University of Technology, Forskargatan 1, SE-931 87 Skellefteå, Sweden; b: SP Technical Research Institute of Sweden, SP Sustainable Built Environment, Skeria 2, SE-931 77 Skellefteå, Sweden; *Corresponding author: alice.wang@ltu.se
INTRODUCTION
Background
Today there are various choices of heating systems for housings, and their efficiency depends on the physical properties of the building materials. The specific heat capacity of wood is 1500 to 1700 J / kg · K, while the corresponding value for concrete is 1000 J / kg · K. This means that at the same weight, the heat storage capacity of wood is higher, which favors the building’s energy (Nyberg 2012). The combination of wood in low thermal conductivity and good heat capacity results in an advantageous phase shift. This means that a wood wall can balance room temperature for a longer time. A stone wall requires approximately double the thickness to achieve the same phase shift (Gustafsson 2006).
To reduce the system’s environmental effect, a key approach is to change the type of energy employed from high quality to low quality energy. Low-quality energy can be seen as utilization of spillage or waste heat from other systems that otherwise are not resolved, i.e. a high utilization of low-quality energy is wanted in a “green” society.
By converting such energy to a moderately low temperature usage, such as a heating alternative for homes or commercial buildings, there is potential to achieve more eco-friendly solutions. Wall heating systems may play a role in such a transformation, with potential to displace the use of radiators.
In the Netherlands, there are laws governing the use of low-quality energy, and as a consequence the wall heating option has been made available (Johannesson and Schmidt 2001). Persson (2000) has stated that research and evaluations of wall heating have shown it to be “very economical”. In Sweden wall heating hardly exists, while in Germany there are a few companies that sell wall heating as a system. Persson (2000) also stated that reduced system temperatures versus larger wall areas results in less heat loss.
A low temperature system is a system in which relatively low temperatures are used to transfer heat to the building. A cryogenic system can also be used as a cooling system without any additional investment costs. A lower flow temperature gives several choices of energy source. When the flow temperature is lower, the employed area must be increased in order to deliver the same effect. There is no general temperature limit to what should be stated as low temperature, since different energy sources require different temperatures to function (Persson 2000).
The use of cryogenic systems creates opportunities to use energy of lower quality. Energy source quality is measured by its “exergy” which is a measure of the difference between the energy state and its environment. A low temperature system’s task is not to save energy, but to save exergy according to Persson (2000). A system that lacks exergy has the same temperature and pressure as its surroundings. Energy from the sun, soil, and water has low exergy, while electricity and fuels have a high exergy. Opportunities to save exergy can be used to justify the use of alternative energy sources and to improve the efficiency of heat pumps (Persson 2000).
The three most common low temperature systems are floor heating, ceiling heating, and wall heating, which belong to the same group of panel heating systems, i.e. radiant heating systems. The use of low temperature increases the thermal comfort in the room, and the system’s energy efficiency (Hesaraki and Holmberg 2013). Using a heat pump in a low temperature system saves energy by raising the Coefficient of Performance (COP). The COP is the ratio between the thermal power released from the heat pump and the drive power to keep the process going. The value of the COP is always greater than one (National Encyclopedia, “Coefficient of Performance” 2013).
The U value is a measure of the amount of heat per unit time passing through a surface when the air temperature difference on either side of the structure is one degree Kelvin (oK). The U-value calculated using Eq. 1 (Sandin 2010),
![]()
where Rsi is the heat transfer resistance on the inside, R1 to Rn are heat transfer resistances of the wall layers, and Rse is the heat transfer resistance on the outside. Thermal resistance R is the resistance to heat transport and is defined as (Sandin 2010),
![]()
where d is the dimension and λ is the material’s thermal conductivity.
Calculation of U-value in the assembled structures
Because wood and insulation material have different thermal conductivity, a mean value should be calculated. For hand calculations, an average value between the U-value method and λ-value method can be used.
U-value method
The U-value method assumes that heat flow occurs perpendicular to the structure, that the heat flow in the materials take place independently of each other, and that no heat flow occurs laterally. The heat transfer coefficient for the entire wall can be calculated as shown in Eq. 3 (Sandin 2010),
![]()
where Uisol is the heat transfer coefficient for the insulation part, Ustuds is the heat transfer coefficient for the wood part, α is the proportion of insulation, and β is the proportion of wood studs.
λ-value method
The λ-value method assumes that materials have infinite thermal conductivity in the transverse direction. Then the flow can be assumed to be equal everywhere. The method in this case involves first calculating a mean λ value (Sandin 2010):
![]()
Then calculate the U-value according to Eq. 1.
The U-value method provides a lower limit estimate for the U-value and the λ-value method provides an upper-limit for the U-value. To be able to determine the U-value of the construction, it has been recommended that an average value of λ-value method and the U-value method should be used (Sandin 2010):
![]()
In designs with dual composition, the regulatory calculations are carried out in four different units: wood – wood, wood – insulation, insulation – wood, and insulation – insulation.
Calculation of U-value of a floor construction
When calculating the U-value for a floor construction, the system is divided into different zones. This is to take into account the varying heat flux dependence on the distance to the outdoor air. The zones are shown in Fig. 1 (Sandin 2010).
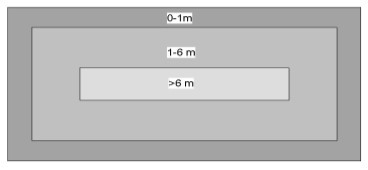
Fig. 1. The zones at the U-value calculation of a floor construction
A U-value for each zone is calculated according to Eq. 1. After that, the calculated U-value is weighted in regard to the corresponding area, and then added to the final U-value.
Objective
Wall heating has become an option for heating homes in part of Europe. The objective of this study is to provide a comprehensive picture of wall heating and its functionality compared to traditional methods. This work focus on three issues: 1) How can a wall heating system be constructed? 2) Which placement of a wall heating system in the house gives the least heat loss? 3) Is the wall heating system an energy efficient option and why is not the system used in Sweden? The study is conducted by means of literature studies, calculations, and a small survey.
DIFFERENT HEATING SYSTEMS AND THEIR EFFICIENCIES – REVIEW OF AVAILABLE LITERATURE
Wall Heating
Wall heating systems are intended to be economical, practical, quickly adjustable, and to provide economical energy consumption. It is also said that the system provides a relief for people with allergies when no dust is set in motion, due to reduced air movement. The right placement of wall heating panels can avoid the movement of cold air from the outer walls. There are large wall panels but also small wall panels where a higher supply temperature is used. Big wall panels provide a larger heated area, which is consistent with a slower heat transfer (Heinze 2013). The capacity for heating and cooling are controlled by parameters such as flow temperature, wall coverings, and criteria for comfort. In comparison with floor heating, there is no upper limit for the system temperature (Heinze 2013). Generally, there are two methods of installation: wet system and dry system.
Wet system (System built on site)
A wet system is similar to a floor heating system, by having its heat piping built into the wall finishes. Rails mounted on the wall and loops snaps on, paired with the distribution line. After installation, wall surfacing is attached by, for example, gypsum board. According to Heinze (2013), the advantage of this system is its geometric flexibility. Fig. 2 shows how a wet system looks after complete assembly.
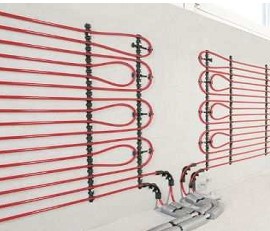
Fig. 2. Installation of a wet system (Rehau, 2013a)
The distance between the pipes depends on the pipe dimension. The thinner the tubes used, the tighter they must be fitted (Persson 2000). Rehau is using a 10 mm tube called RAUTHERM S, and it may be added with a distance of 2.5 cm and greater.
Dry system (System prefabricated)
A prefabricated wall heating panel is called a “Dry system”. Actually it is the same as “Wet system”, which is carrying “water” as fluid flows through the channels. A dry system is illustrated in Fig. 3 and it consists of prefabricated gypsum boards, where tubes of any dimension are cast into the panel. When assembled, the panels are fixed against substructure made of metal or wood by screws, and then the panels are connected to the main heat distribution line. A dry system is useful in constructions where the installation must go quickly. In comparison to a wet system, the dry system can be put into operation immediately after installation (Heinze 2013). However, a problem that applies to both a wet and a dry system is how the system should fulfill the requirements for safe water installation (El Kari 2013).
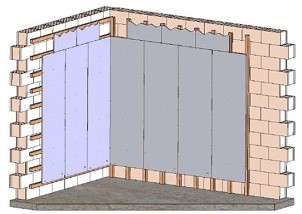
Fig. 3. Installation of a dry system (Heinze 2013)
Aeration of a wall heating system
A wall heating system resembles a radiator system where air must be removed. Because of the small pipe dimensions in a wall heating system, no still water or air pockets are formed. This leads to that no single heating panel needs to remove air after installation. The air possibly comes into the system with time, due to diffusion, is removed from the heating control central unit at each home (Jakobsson 2013).
Thermostats
In order to control the flow in the piping, thermostats are used. Rehau provides control of each single room via both cable and remote control (Rehau, 2013b).
Flow temperature
The flow temperature to be used is controlled by the heat demand, the size of the heated area, the heat transfer resistance, and the type of wall heating system (Persson 2000).
Comparison of Floor, Ceiling, and Wall Heating
A study conducted at the University of Kragujevac in Serbia compared floor, ceiling, and wall heating (Bojic et al. 2013). The simulation was performed on a two-story house with a living space of 190 m2. The U-value for the outer walls was 0.57 W/m2K and for the windows was 2.72 W/m2K. The building was situated in Kragujevac. The study conducted four simulations with wall heating, floor heating, ceiling heating, and combined floor-ceiling heating during the period of October 15 to April 15. Wall heating was assumed to be used only in the exterior walls. All simulations used a flow temperature of 37 oC (Bojic et al. 2013).
The energy consumption is the energy required to keep the desired indoor climate. In the four models, the combination of floor-ceiling heating provided the lowest energy consumption (8310 kWh/year), and the highest was the system with the ceiling heating (11,420 kWh/year). In each of the single system, wall heating required the lowest energy to achieve the desired indoor climate (9200 kWh/year), and it was only about 10% higher than floor-ceiling heating (Bojic et al. 2013).
The use of exergy shows the exergy supplied to the boiler by natural gas, the exergy destroyed during heat transfer between the boiler and heating panels, and the exergy consumed by the heating panels. Exergy is a tool for using energy more efficiently. The ceiling heating had the largest supplied exergy, consumed exergy, and the destroyed exergy (704 MJ, 115 MJ, and 590 MJ). The lowest was for the floor-ceiling heating (551 MJ, 88 MJ, and 463 MJ). The second lowest was the wall heating (636 MJ, 103 MJ, and 533 MJ) (Bojic et al. 2013).
Flow Patterns and Thermal Comfort in a Room
In a study from the Royal Institute of Technology (KTH) in Stockholm, two Computational Fluid Dynamics (CFD) models for an office were made. The room is 4.8 x 2.4 x 2.7 meters with two windows disposed. The difference between the two models of the office is that the second model has better insulated walls and windows, as well as another type of ventilation. In both cases, the ventilation air is identical with equal incoming volume and temperature. The climate outside the office was set to a typical Swedish climate with -5 oC temperature (Myhren and Holmberg 2008).
The heating system study compared: 1) Medium temperature radiator in medium size (MT-radiator); 2) High-temperature radiator with a smaller size (HT radiator); 3) Floor Heating; and 4) Wall heating.
The “occupied zone” where measurements were performed was 0.6 meters from all the walls and up to 1.8 meters above the floor surface. For a person sitting in the room, cold air at a speed of 0.15 m/s or higher is uncomfortable.
Office Model One
The U-value of the wall with windows (including the windows) was determined to be 0.35W/(m2K). The results of air velocities in the room are shown in Fig. 4. The ventilation brought cold air into the model and in the case of wall heating, the cold air reached almost halfway into the room before being mixed with the existing air. This was also the case with floor heating. In both cases, air speeds were created that were higher than the recommended 0.15 m/s in the occupied zone.
In the cases of radiators, the warm air is rising and blocking the cold air before reaching the occupied zone. Overall, the cold air reaches the furthest in a room in the case of floor heating, and for wall heating the temperature gradient is a little bigger than for floor heating (Myhren and Holmberg 2008).
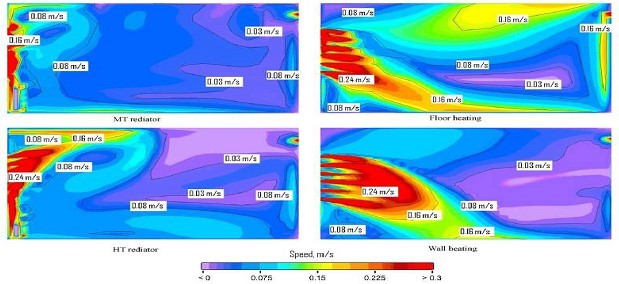
Fig. 4. Simulation in Office Model One, where the air speed is reported for the MT radiator, HT radiator, Floor, and Wall heating (Myhren and Holmberg 2008)
The percentage of dissatisfied people in the occupied zone depends on the air speed and thermal comfort. PPD stands for “Predicted Percentage of Dissatisfied” where a low PPD percentage means that the air velocity and thermal comfort is good for a person working in the office. For both wall and floor heating, the PPD values are close to 5% in most occupied zones. For the radiators heating, PPD values are a little higher, just above 5% in the occupied zone (Myhren and Holmberg 2008).
Office Model Two
The results of the simulation in Office Model Two are shown in Fig. 5. In all four simulations, the cold air flows from the ventilation with a velocity of 0.5 m/s before reaching the floor surface. The highest air velocity was created from radiators closest to the window. At the wall opposite to the window, the air is still. For wall heating the cold air flowed along the floor to the walls where it began to rise up to the ceiling and then pushed down into the middle of the room (Myhren and Holmberg 2008).
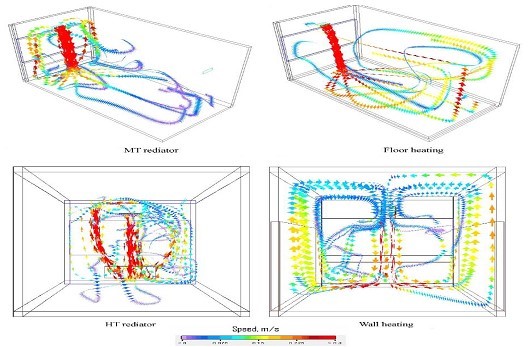
Fig. 5. Simulation of Office Model Two where the wind flow is reported for the MT radiator, HT radiator, Floor, and Wall heating (Myhren and Holmberg 2008)
The percentage of dissatisfied people has shown that the radiators created the best thermal indoor climate. This is because the cold air is heated directly as it enters through the ventilation. In the case of floor heating, the cold air was required to reach the floor surface to achieve an acceptable temperature. In the case of wall heating, the temperature gradient increased the further away from the place where the cold air came. This is due to the fact that the distance to the nearest wall panel increased, and gave a PPD of 10% at the opposite wall.
Cold draft
Cold air that lies along the floor can create a feeling of discomfort. In the cases of the radiators, there is no cold draft that reaches the occupied zone. In case of floor and wall heating, the cold draft reaches the occupied zone. Wall heating system has difficulties to deal with cold drafts, which is a weak point for this kind of heating system, and will be felt more in large rooms (El Kari 2013).
Vertical temperature gradients
When the difference in temperature gradient is greater than 3 °C, it can lead to comfort problems. The vertical temperature gradients are measured at two points: 0.1 m and 1.1 m above the floor in the occupied zone. In the case of MT radiator the difference was 0.5 oC and for floor heating was a little higher. The largest temperature gradient was found in the wall heating system due to the hot air pocket created adjacent the ceiling. The value was just about equal to the critical value of comfort problems. In the center of the room there is the largest temperature gradient of wall heating and the lowest temperature gradient for floor heating (Myhren and Holmberg 2008).
Comparison between Radiator and Wall Heating
In the study conducted in Serbia, it was demonstrated that a wall heating system requires less energy than a radiator system for heating a building. The house model for the simulation was a fictitious two-story house located in Belgrade with a gross floor area of 301 m2. The simulation program used is called ”Energy Plus”. The U-value for the outer walls was adapted to 0.57 W/m2K and the double-glazed windows determined the U-value of 2.72 W/m2K. The estimated capacity of the building was eight people. In the simulations, radiators were placed on the coldest surface in every room. Wall heating panels were placed on all exterior walls of a total area of 212 m2. In the simulations, the building was insulated with a wool disc containing 70% of air to increase the line resistance of the outer walls (Bojic et al. 2012). In the study, four simulations are:
- Radiators without wool disc (RH WOI)
- Radiators with wool disc (RH WI)
- Wall Heating without wool disc (PH WOI)
- Wall Heating with wool disc (PH-WI)
Figure 6 shows the results from the study. It shows that the simulation of wall heating systems requires less energy than the same simulation with radiators. Also, the thermal insulation of external walls has a greater effect in a wall heating system, in comparison to conventional radiator systems.
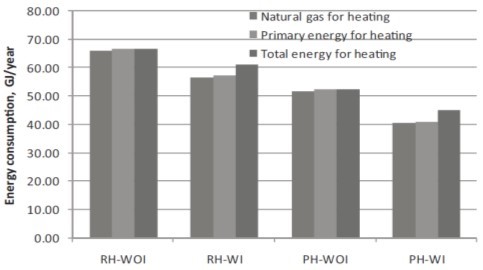
Fig. 6. Energy consumption from October 15 to April 15 (Bojic et al. 2012)
METHODS
Simulation of EnergyPlus
A structural model was created in the program IDFEditor. The model was basically created by the Myresjöhus showcase house “Annero,” which is the most representative model of the single family light-weight wooden house in Sweden (Fig. 7). The weather files used in the simulations were chosen in different regions in Sweden (west coast – Gothenburg, east coast – Stockholm, middle of the Sweden – Östersund, and the far north city – Kiruna). They represent different climates in Sweden. These weather files were accessible from the US Department of Energy’s website (2013). Software used for the simulations is called ”Energy Plus”.
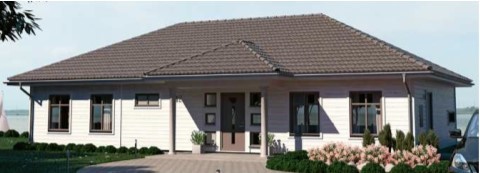
Fig. 7. Picture of the house ‘‘Annero’’ used in the simulation (Annero 2013)
U-values
The calculated U-values according to Eq. 1 for the construction are presented in Table 1.
Table 1. Calculated U-values According to the U-value Method
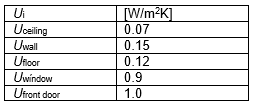
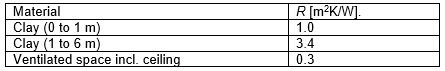
The data for the windows were taken from Elitfönster’s website (2013). The data for the outer doors were taken from Skånskabyggvaror.se’s website (2013). Table 2 shows specific heat transfer resistances between the air and a specific building element. The λ-values and the heat transfer resistances used in the calculations are presented in Tables 3 and 4.
Table 2. Heat Transfer Resistance between the Air and a Specific Building Part (Sandin 2010)
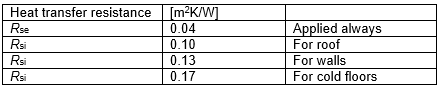
Table 3. Using λ-values in the Calculations (Sandin 2010)
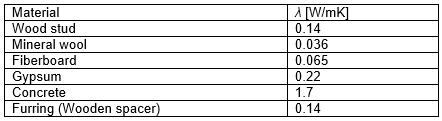
Table 4. Using Heat Transfer Resistances R (Sandin 2010)
The parts of the building model
The building is a light frame with cladding. The construction of interior wall is shown in Fig. 8 (a), and they contain mineral wool to absorb noise inside the building. The exterior walls are constructed as shown in Fig. 8 (b). Ceiling and floor construction is shown in Fig. 9.
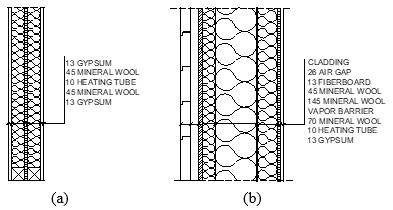
Fig. 8. Sketch for building interior walls (a), exterior walls (b) (mm)
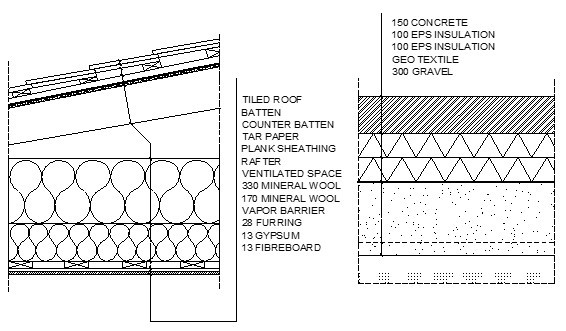
Fig. 9. Sketch for building ceiling and the floor (mm)
The layout of the model building
The building’s floor plan is shown in Fig. 10. The floor plan is divided into 12 zones.
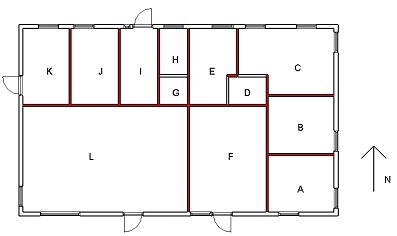
Fig. 10. The building’s floor plan where each zone is designated with a letter
Simulation
In previous studies (Myhren and Holmberg 2008; Bojic et al. 2012, 2013), simulations were already done for the comparisons among the floor, ceiling, wall, and radiator heating. Therefore, further simulations were done only to evaluate the heat panel locations in three different models. In all simulations, it was assumed that all the rooms in the building are vented with 0.5 exchange of its volume per hour.
- Model One: Wall heat in only the outer walls
- Model Two: Wall heat in only the inner walls
- Model Three: Wall heat in only the inner walls but with the same linear meters of heating panel as in Model One (Red colored inner walls in Fig. 10).
All the simulations were made with empty rooms, that is, without regard to the number of people living in the building. Likewise, no account was taken to electrical products that provide free energy. The only source of free energy that was incorporated into the simulations is solar radiation through the windows. Free energy from people and the building components were not chosen because they are not affected by the heat source placement.
Simulation of Model 1
The simulation of Model 1 assumed wall-heating panels to be mounted in the exterior walls. Wall heating panel was assumed to be in the gypsum layer, as shown in Fig. 8 (b). Thermostats are only in the zones containing an exterior wall, i.e. all zones except G and D. The interior walls are constructed as shown in Fig. 8 (a). The building has a total of 51 meters exterior wall, where the wall heating panels are assumed to be located.
Simulation of Model 2
During simulation of Model 2, wall-heating panels was assumed to be installed in all interior walls. The exterior walls are constructed as shown in Fig. 8 (b). Wall heating panel is mounted in the middle of the two mineral wool layers in the interior walls as shown in Fig. 8 (a), then the distances to each side of the interior wall were equal. Thermostats are available in all zones but control only some of the walls in each zone. This is because the wall between two zones cannot be controlled by two thermostats. The building has a total of 55.5 meters interior walls with mounted heating panel.
Simulation of Model 3
The simulation of Model 3 is identical to the simulation Model 2, but with the difference that the number of internal walls containing heating panels has been reduced. The walls containing heating panels are shown in Fig. 10 (Red colored interior walls in Model 3 containing wall-heating panels.). In total, the Model 3 get 51 m long of interior walls containing heating panels.
Survey
The purpose of the survey was to create a picture of how a profession considers wall heat as a heating system. The questions were designed to be simple to understand. In total there were 13 questions in this survey. To find respondents to the survey, the website allabolag.se was used in order to be able to find active companies in the HVAC industry in Sweden. A total of 65 respondents in 14 different companies were chosen. They were 36 HVAC designers, 23 HVAC planners, and 6 HVAC technicians selected as respondents. The companies are from Lycksele in the north to Malmö in the south. A majority of companies are in Mälardalen. The questionnaire was created and published on the website Enkät.se. A direct link was created to the survey, which then was distributed to respondents via email. The questionnaire was then allowed to remain open for 19 days before the results were compiled. Only 22 people answered the survey.
RESULTS AND DISCUSSION
Results of the Simulations
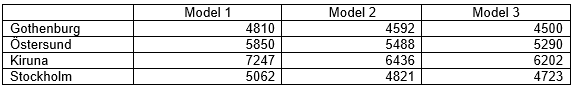
Tables 5 and 6 show the total energy needed and heat losses through the external building parts in four cities for Models 1, 2, and 3. In general, the colder the city, the higher the energy is needed, and the heat losses become higher in all three models. Kiruna is the coldest, followed by Östersund. Gothenburg and Stockholm are not much different. But in each city, the total energy needed and heat losses did show a big difference for Model 1. The lowest energy needed and heat losses through the external building parts was Model 3, and Model 1 was the highest in these three models and in all four cities. The heat loss values in all three models did not take the window into account.
Table 5. Simulation Results of Energy Needed for Models 1, 2, and 3 [kWh]
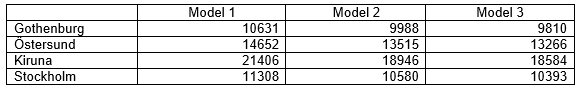
Table 6. Simulation Results of Heat Losses through the External Building Parts (excluding windows) for Models 1, 2, and 3 [kWh]
The reason why Models 2 and 3 require less energy than Model 1 is due to the reduced heat losses through external building parts. The important thing to remember is how the internal walls of Models 2 and 3 are constructed and what materials they contained. This has a large impact on the total energy demand. During the simulation of Model 2, when there is only air in the interior walls, the energy requirement is much lower than in the cases of mineral wool in the interior walls. The difference between the models is also influenced by the small differences between the heat losses through windows and ventilation. The difference between Models 2 and 3 is not big, because the panels that were removed in Model 3 (Fig. 10 of D and G zones) actually did not provide much influence in the case of Model 2.
Results of the Survey
Of those who participated in the survey, only 45% had heard of wall heating, and 36% of the participants knew what a wall heating system is. None of the participants had constructed or installed a wall heating system. The majority of respondents felt that wall heating has an average energy consumption and installation cost. Also, 57% said that a wall heating system is not user friendly, but only 12% thought that usability is a key factor in the choice of heating system. The factor that mattered most was the energy consumption. This answer was selected by 50% of the respondents.
It is worth noting that 44% of the respondents considered that wall heating is an inappropriate method for heating of buildings. This is because of the high risk of damage to the system, as well as the complication and expense of installation. The reason that the wall heating system is not used depends largely on the fact that the method is unknown by potential users. And those who have knowledge of the system consider a relatively large part of the method not suitable for use because of its disadvantages. One disadvantage is the need for hidden installation, which creates a problem for a safe water installation and difficulties in the attachment of fixtures. Additionally, the system has difficulty in dealing with cold drafts.
CONCLUSIONS
According to the simulation made in the Energy Plus, a placement of wall heating panels in the interior walls shows lowest energy losses. Wall heating provides another indoor climate, but whether the advantages outweigh the disadvantages may need to be assessed for each individual case. The reason that the wall heating system is not used as of today in Sweden depends largely on the fact that this method is too unknown to house manufacturers. And those who have knowledge of the system consider a relatively large part of the method to be unsuitable for use because of its disadvantages, which include its hidden installation, which creates a problem for a safe water installation and difficulties in the attachment of fixtures, and that the system has difficulties in dealing with cold drafts. But the purpose of a wall heating system is to lower the system temperature and to conserve energy.
Future work should look at the issues on how wall-heating systems could be combined with other low-temperature systems.
REFERENCES CITED
Bojic, M., Cvetkovic, D., Miletic, M., Malesevic, J., and Boyer, H. (2012). “Energy, cost and CO2 emission comparison between radiant wall panel systems and radiator systems,” Energy and Buildings 54, 496-502. DOI: 10.1016/j.enbuild.2012.04.024
Bojic, M., Cvetkovic, D., Marjanovic, V., Blagojevic, M., and Djordjevic, Z. (2013). “Performances of low temperature radiant heating systems,” Energy and Buildings 61, 233-238. DOI: 10.1016/j.enbuild.2013.02.033
El Kari, S. (2013). VVS-Konstruktör FLK. Intervju. [Design Engineer FLK, Interview]. 2013-04-19.
Elitfönster (2013). “Elit Extreme,” Retrieved 5 April 2013. (http://www.elitfonster.se /sv/Fonster–altandorrar/Elit-Extreme/Dokument /#ContentStart).
Gustafsson, A. (2006) Massivträ. Handboken, Industrikonsortiet Massivträ [Solid wood. Handbook. Industrial consortium of solid wood]. (http://www.martinsons.se/default.aspx?id=9090). Retrieved 13 March 2013.
Heinze (2013). “Wandheizsysteme, Deckenheizesysteme,” [“Wall heating systems, ceiling heating systems”]. Retrieved 19 March 2013. (http://www.heinze.de/produktserie/wandheizsysteme/9865326/1).
Hesaraki, A., and Holmberg, S. (2013). “Energy performance of low temperature heating systems in five new-built Swedish dwellings: A case study using simulations and on-site measurements,” Building and Environment 64, 85-93. DOI: 10.1016/j.buildenv.2013.02.009
Jakobsson, N. (2013). “Tekniksupport,” [Technology Support]. VVS Rehau. E-mail. 2013-04-22.
Johannesson, G., and Schmidt, D. (2001). “Energi eller exergi – En kvalitetsfråga,” [“Energy or exergy – A quality issue”], Miljöforskning [environmental research], no. 5-6, 2001.
Myhren, J. A., and Holmberg, S. (2008). “Flow patterns and thermal comfort in a room with panel, floor and wall heating,” Energy and Buildings 40, 524-536. DOI: 10.1016/j.enbuild.2007.04.011
Myresjöhus, “Annero,” (2013). Retrieved 14 April 2013. (http://www.myresjohus.se/vara-hus/sok-hus/1-planshus/annero/).
Nationalencyklopedin, “Värmefaktor,” [National Encyclopaedia, “Coefficient of Performance”]. 2013. Retrieved 29 April 2013. (http://www.ne.se.bibl.proxy.hj.se/v%C3%A4rmefaktor).
Nyberg, A. (2012). “TräGuiden: Värmeegenskaper. Svenskt Trä,” [Wood guide: Thermal Properties. Swedish Wood]. (http://www.traguiden.se/om-tra/materialet-tra/traets-egenskaper/termiska-egenskaper1/varmeegenskaper/). Accessed 1 March 2013.
Persson, T. (2000). “Lågtemperatursystem – En kunskapsöversikt,” [“Low temperature system – A knowledge”]. 2000. Retrieved 19 March 2013. (http://www.diva-portal.org/smash /get/diva2:522704/FULLTEXT01.pdf).
Rehau. (2013a). “Väggvärme/-kyla” [“Wall heating/cooling”]. Retrieved 19 March 2013. (http://www.rehau.com/se-sv/bygg-och-anlaggning/golvvarme-kyla-och-radiatorsystem/golvvarme-och-kyla-i-bostader/vaggvarme-och-kyla-for-puts/)
Rehau.(2013b) “Angenäm värme och kyla i ett och samma system”, [“Pleasant heating and cooling in one system”]. Retrieved 20 March 2013. (http://www.rehau.com/se-sv/bygg-och-anlaggning/golvvarme-kyla-och-radiatorsystem/golvvarme-och-kyla-i-bostader/reglerutrustning)
Sandin, K. (2010). Praktisk Byggnadsfysik [Practical Building Physics], 1.1 edn, Studentlitteratur AB, Lund, 2010.
SkånskaByggvaror.se. (2013). “Ytterdörr Nyhamn”, Retrieved 5 April 2013. (http://www.skanskabyggvaror.se/produkter/dorrar/borgaserien/nyhamnv3012=3012-62)
U.S. Department of Energy, “Weather data,” Retrieved 4 April 2013. (http://apps1.eere.energy.gov/buildings/energyplus/cfm/weather_data3.cfm/region=6_europe_wmo_region_6/country=SWE/cname=Sweden).
Article submitted: August 11, 2015; Peer review completed: September 20, 2015; Revised version received and accepted: November 4, 2015; Published: November 23, 2015.
DOI: 10.15376/biores.11.1.530-544