
Abstract
To prevent the illegal trade of precious wood in circulation, a wood species identification method based on convolutional neural network (CNN), namely PWoodIDNet (Precise Wood Specifications Identification) model, is proposed. In this paper, the PWoodIDNet model for the identification of rare tree species is constructed to reduce network parameters by decomposing convolutional kernel, prevent overfitting, enrich the diversity of features, and improve the performance of the model. The results showed that the PWoodIDNet model can effectively improve the generalization ability, the characterization ability of detail features, and the recognition accuracy, and effectively improve the classification of wood identification. PWoodIDNet was used to analyze the identification accuracy of microscopic images of 16 kinds of wood, and the identification accuracy reached 99%, which was higher than the identification accuracy of several existing classical convolutional neural network models. In addition, the PWoodIDNet model was analyzed to verify the feasibility and effectiveness of the PWoodIDNet model as a wood identification method, which can provide a new direction and technical solution for the field of wood identification.
Download PDF
Full Article
Wood Microscopic Image Identification Method Based on Convolution Neural Network
Ziyu Zhao,a Xiaoxia Yang,a Zhedong Ge,a,* Hui Guo,b and Yucheng Zhou a,b
To prevent the illegal trade of precious wood in circulation, a wood species identification method based on convolutional neural network (CNN), namely PWoodIDNet (Precise Wood Specifications Identification) model, is proposed. In this paper, the PWoodIDNet model for the identification of rare tree species is constructed to reduce network parameters by decomposing convolutional kernel, prevent overfitting, enrich the diversity of features, and improve the performance of the model. The results showed that the PWoodIDNet model can effectively improve the generalization ability, the characterization ability of detail features, and the recognition accuracy, and effectively improve the classification of wood identification. PWoodIDNet was used to analyze the identification accuracy of microscopic images of 16 kinds of wood, and the identification accuracy reached 99%, which was higher than the identification accuracy of several existing classical convolutional neural network models. In addition, the PWoodIDNet model was analyzed to verify the feasibility and effectiveness of the PWoodIDNet model as a wood identification method, which can provide a new direction and technical solution for the field of wood identification.
Keywords: Wood identification; Microstructure; Convolution neural network
Contact information: a: School of Information and Electrical Engineering, Shandong Jianzhu University, Jinan, 250101, China; b: Research Institute of Wood Industry, Chinese Academy of Forestry, Beijing, 100091, China; *Corresponding author: gezhedong@sdjzu.edu.cn
GRAPHICAL ABSTRACT
INTRODUCTION
Wood identification is widely used in customs, import and export quarantine inspection, and other fields. In addition, to prevent valuable timber from being illegally traded in circulation, timber identification technology is important for modern timber industry and monitoring timber trade.
Traditional wood identification is based on the anatomical microscopic and macroscopic characteristics of the wood species, such as the difference of wood color, texture, and microstructure. Ravindran and Wiedenhoeft (2020) proposed a species-level Xylot ron computer vision model and identified 10 Meliaceae species at the species-level and genera levels. Wang et al. (2019) used THZ-TDS (terahertz timedomain spectroscopy) technology for nondestructive testing of wood, and classified wood by manual feature extraction combined with support vector machine. Vishal et al. (2020) provided a rapid and non-destructive method to identify wood by ATR-FTIR (attenuated total reflection Fourier transformed infrared) and chemometrics. Linear discriminant analysis (LDA) was used to classify unknown wood samples, but the accuracy of this method was low. In recent years, more experts have applied machine vision technology to wood identification and classification, but the existing wood identification training parameters are still numerous, the training time is long, and the classification accuracy is still low (Zhu and Wang 2014; Ge et al. 2016, 2018).
Convolutional neural network was a type of feedforward neural network with convolution computation and depth structure (Gu et al. 2018). With the ability of representational learning, the input information can be classified according to the translational invariant structure of each layer, and the basic features of the input object can be extracted with little or no human intervention. Convolution and pooling layers were first implemented in the early 1980s. The approach was applied to the LeNet model in 1989 and the concept of convolution was first introduced, but only in the theoretical stage (Lécun et al. 1989; Lécun et al. 1998). The AlexNet model appeared in 2012 (Krizhevsky et al. 2012), and the neural network was gradually applied in practice and continually updated. The existing structures of the convolutional neural network model mainly include the input layer, the hidden layer, and the output layer, among which the hidden layer is composed of the convolutional layer, the pooling layer, and the full connection layer. The convolutional layer is used for feature extraction of input data, and the convolution layer is used to check the input features for integral operation. The pooling layer is used for feature selection and information filtering of the feature graph output after convolution operation. The full connection layer is a nonlinear combination of extracted features to obtain the output (Kiranyaz et al. 2016; Chen et al. 2017). Up to now, the recognition rate of LeNet-5, AlexNet, VGG, GoogLeNet, and other models has been improved continuously. However, with the deepening of network layers, the parameters are too much, the calculation speed is reduced, and the efficiency is affected (Chen et al. 2017).
To implement the traditional microscopic anatomical feature identification method, it is necessary to dissect the transverse, radial, and chord three-dimensional sections of wood samples and obtain the image with high-power microscope after dyeing (Fei et al. 2007; Zhang et al. 2018). The detection and classification time is very long, and the accuracy of judgment is low. Compared with the previous results, the main contributions of this paper can be summarized as follows: (1) In this paper, a PWoodIDNet model for the identification of rare tree species was proposed. In this model, the decomposition convolution kernel was adopted to reduce the network parameters, and the model classification and update were realized by GPU parallel algorithm, which effectively improved the accuracy and speed of wood identification. (2) A CT (computed tomography) microscopic image technique was used to obtain the microscopic image of the cross section of the wood sample as the input of the discriminant algorithm, which does not need to carry out the microscopic dissection of the wood, and the classification results can be obtained by the proposed PWoodIDNet.
In this work, the CT microscopic image, as the input of PWoodIDNet model, plays a crucial role in the classification effect of the model. The model and detection method proposed in this paper will provide advanced identification methods and instruments for import and export quarantine and inspection departments.
Theory
Construction of PWoodIDNet model
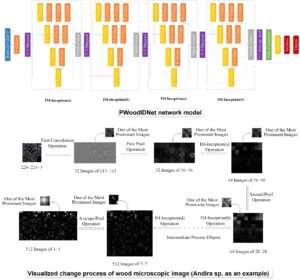
In this work, a valuable tree species identification model named PWoodIDNet was constructed. The total number of network layers was 72. The convolution kernel is the weighted average of the pixels of a small area in the input image to become each corresponding pixel in the output image, where the size of the weight value is the size of the convolution kernel. GPU parallel operation was used in the model, and the convolution layer of the model was used the form of deconvolution kernel to stack several small convolution kernels, named the improved Inception module, and referred to as IM-Inception. The IM-Inception module can reduce the operation parameters and set the step size as 1 to keep the size of the output feature graph unchanged, so as to improve the operation efficiency of the neural network. After convolutional layer and IM-Inception of the PWoodIDNet model, 4 maximum pool layer, and 1 average pool layer were respectively set up, so as to achieve the goal of feature selection and lowering the dimensionality. After the full connection layer of the model, the Dropout method is set to suppress the over-fitting phenomenon. The overall structure of the model is shown in Fig. 1.

Fig. 1. PWoodIDNet network model
Items in Fig. 1 can be described as follows: Each dashed box in Fig. 1 represents the image decomposition convolution operation, which used the IM-Inception module. The blue box represents the input image size of 224×224, the orange box represents the convolution kernel size of 3×3 and 5×555, the yellow box represents the convolution kernel size of 1×1, the gray box represents the aggregation on each branch output channel, the purple box represents the maximum pooling layer of 3×3 and the average pooling layer of 7×7, the green box represents the full connection layer, and the red box represents the Softmax classifier and output.
The Inception module used in the current GoogLeNet network framework is connected by a convolution core of 1 × 1, 3 × 3, 5 × 5, and a maximum pooling of 3 × 3, and is dimensionally reduced by adding a convolution core of 1 × 1 size before each convolution and pooling layer (Szegedy et al. 2015). Because the convolution kernel is a convolution operation on the output image of the previous layer, the computational effort required for a 5 × 5 convolution kernel will be large. It will also cause the thickness of the feature map to increase, affect the speed of model operation, and result in a lower model performance and a higher power consumption. Therefore, the IM-Inception module is an improvement on the existing Inception module. The 5 × 5 convolution kernel and the maximum pooling of 3 × 3 are replaced by 2 sets of 3 × 3 convolution kernel and 3 sets of 3 × 3 convolution kernel. The IM-Inception module can reduce the calculation parameters, deepen the network width, and improve the adaptability of the network to the scale.
To intuitively understand the specific parameter setting of PWoodIDNet network, the specific parameters of PWoodIDNet network structure are introduced in Table 1. The input image size is set to 224 × 224 × 3, in which 224 × 224 represents the image resolution and 3 represents the number of image channels. In Table 1, “#3 × 3 reduce1, #3 × 3 reduce2 and #3 × 3 reduce3” indicates the number of 1 × 1 convolution used before one 3 × 3, two 3 × 3, and three 3 × 3 convolution operation. “1#3 × 3, 2#3 × 3, 3#3 × 3” indicates the number of convolution kernels in one 3 × 3, two 3 × 3, and three 3 × 3.

The Dropout method was added after the full connection layer of the model. The Dropout method can make half of the feature detectors stop working, improve the generalization ability of the network, and suppress the overfitting phenomenon. The output layer was constructed, and Softmax classifier was used for classification, with the number of classification being 16. The model sets the ReLU activation function and batch normalization (BN) after each convolution layer and full connection layer. ReLU activation function serves to reset the output of some neurons to zero, which reduces the sparsity of the network and the interdependence of parameters, so that the model can better extract the image related features, fit the training data, and calculate easily. BN layer can accelerate the convergence speed of network training, control gradient explosion, prevent gradient from disappearing, and also avoid overfitting phenomenon to a certain extent. Data augmentation of the data set can also reduce the occurrence of overfitting and improve the generalization ability of the convolutional neural network model.
EXPERIMENTAL
Materials
The specimens were collected from the Wood Herbarium of Shandong Architecture University, Jinan City, Shandong Province, China. Sixteen kinds of precious wood samples were selected as experimental objects, as shown in Table 2. A high-resolution microscopic CT imaging system was adopted to collect microscopic images. The microscopic images are cross-section images of wood as samples. The data set of cross-section microscopic CT images of wood was composed of cross-section microscopic images of softwood and hardwood, of which the softwood had tracheids, which the hardwood was composed mainly of a combination of libriform fibers and multi-cellular vessels, which serve and conduits for water going upwards in the tree. Among them, the classification of timber species with similar microstructure was more complex, so it is particularly important to effectively improve the quality and quantity of samples. The image size of samples collected is 1036 × 1036.
Experimental Equipment
For the data acquisition equipment, a SKYSCAN1272 high resolution microscopic CT from the Wood Herbarium of Shandong Jianzhu University, Jinan, Shandong, China was used. The optical tube voltage was 50 kV and the current was 200 μA. The wood sample was processed into a cylinder with a certain diameter. The diameter of the test sample was approximately 2 mm and the height was approximately 8 mm. To prevent moisture volatilization, the sample was wrapped and sealed with a sealing film, and then the sample was vertically fixed to the high-resolution microscopic CT sample rod with lighter weight paraffin wax and placed into the instrument. The sample was adjusted to the center position of the field of vision, and the center position was adjusted and maintained at any time in the subsequent steps.
The resolution of microscopic CT was 0.95 μm, and the data were collected every 0.1° rotation of the sample. Each time, 3600 rows and 1280 columns of data were obtained until the 180° scanning of the sample was completed, which took 3 h and 45 min. The projected image was reconstructed into a two-dimensional cross-section image using Nrecon layered reconstruction software (Bruke Corp, Karlsruhe, Baden-Wurttemberg, Germany) to eliminate the adverse effects caused by ring artifacts and ray hardening, and then smoothing and other display settings were performed.

The hardware used in the test system was AMD Ryzen Threadripper 2920X CPU @3.5 GHz, memory was 128 GB, GPU graphics card was NIVIDIA GeForce RTX 1080Ti. The algorithm contained a large number of repeated operations and parallel operations. GPU operation library was used to play the role of parallel optimization and improve the accuracy and efficiency of training model.
Methods
Data augmentation
A total of 800 microscopic images of 16 kinds of wood were used in the experiment, and then a total of 2400 microscopic images of the target area with parenchyma, tube fullness, and duct features were intercepted, and the sample image size was 224 × 224 pixels. Then, the image was rotated 90°, the gray value was reduced, and the image enhancement algorithm, such as Gaussian filter, was added to expand the data set to 9600 pieces, that is, the wood microscopic dataset. The data enhancement process took Andira sp. as an example, as shown in Fig. 2.

Fig. 2. Data enhancement process (Andira sp. as an example)
Model training
The training times of the model were 4200, the learning rate was 0.0001, and Batch size was 16. The initial values of the weight parameters and bias parameters of the network model were randomly generated by the truncated normal distribution with mean value μ = 0 and standard deviation σ = 0.01. The output of the full connection layer of the model was 16. A stochastic gradient descent optimization algorithm with momentum term added to parameter updating was adopted, this was SGDM (Rumelhart et al. 1986). This was to alleviate the model oscillation.
RESULTS AND DISCUSSION
Visual Model Analysis
To intuitively show the effectiveness of feature extraction of wood microscopic identification model, the visualization analysis of the convolutional layer and pooling layer of the model is helpful to debug the convolutional neural network structure and optimize the network parameters (Huang and Wang 2019). Through the visualization method, the features extracted from the shallow part of the network are similar to those manually extracted, such as edge, texture, contour, and so on. In the process of network forward propagation of wood microstructure samples, the visualization results of PWoodIDNet network structure response were analyzed. Taking Andira sp. as an example, the output images after operation were analyzed, including the original image, first convolution, first pooling, IM-Inception(a), second pooling, IM-Inception(d), and average pooling layer, as shown in Fig. 3.

Fig. 3. Visualized change process of wood microscopic image (Andira sp. as an example)
In Fig. 3, after the first convolution training of the input image, the output feature map of the first convolution was obtained, and the wood microstructure in the output image was clearly visible, including the microscopic features of axial parenchyma, ductal tracheids, intercellular channels (colloidal channels), inclusions, and so on. The output image after the first convolution was taken as the input to carry out pooling operation. After the first pooling training, the output feature map of the first pooling was obtained. Through comparing the original image and the first pooling, it can be seen that the first pooling was able to effectively retain the feature information extracted by the convolutional layer while reducing the image size.
The output feature mapping of the image after IM-Inception(a) convolution processing shows that most of the images were able to clearly recognize the edge contour information of wood microstructure, which shows that the network in IM-Inception(a) convolution not only has the ability to extract the features of the input data, but also has the ability to enhance the feature information and filter the noise. The output feature mapping of image after IM-Inception(d) convolution and average pooling layer processing showed that with the deepening of the number of layers, the output image of convolution neural network exceeded the deep level abstract features intuitively understood by human beings, and the captured feature map was more complex and abstract, which required more small convolution cores and deeper network layer, and with it comes more complex network structure, more network parameters, and operations.
Analysis of Test Results of Different Convolution Neural Network Models
In order to verify the validity of PWoodIDNet model, the classification accuracy and the change of loss value were verified on the dataset. Among them, “Classification accuracy” refers to the ratio of the number of samples correctly classified by the classifier to the total number of samples for a given dataset. Classification accuracy can be used to determine whether the classifier is effective or not. “Validation loss” was the cross entropy loss of multi class classification problems with mutually exclusive classes. Results are compared with the most commonly used convolution neural network model, including AlexNet, GoogLeNet, VGG16 model, as shown in Figs. 4 and 5.

Fig. 4. Classification accuracy curve of network model
Figure 4 shows the classification accuracy curve of the network model. With the increase of iteration times, the model accuracy of PWoodIDNet model curve noticeably improved and gradually converged. When the iteration times reached 300, the accuracy was 99% and continued until the completion of iteration, which reflected the high classification accuracy of PWoodIDNet model and verified the validity of network model. The classification accuracy of GoogLeNet was slightly lower than that of PWoodIDNet model. When the number of iterations reached 300, the Accuracy curve of GoogLeNet slowed down and the curve still oscillated. However, as the number of iterations increased, the curve gradually converged.
At the beginning of iteration, the curve oscillation of VGG16 and AlexNet models was quite serious, and the classification accuracy was low at this time, with the average classification accuracy of approximately 75%. In the middle iteration, the curve gradually converged, without drastic fluctuations, and the average accuracy was above 93%. According to the accuracy curve of LeNet-5 model, when the number of iterations reached 4200, the curve continued to grow slowly. After the number of iterations increased, the training curve showed a trend of waveform growth.
Figure 5 shows the verification loss rate curve of the network model, the initial loss value of the PWoodIDNet model was large, but it can be rapidly reduced with the increase of training steps. An inflection point occurred when the number of iterations reached 200. At that point the curve gradually tended to converge until the end of the iteration, reflecting the increase of layers of the PWoodIDNet model, saving a large number of parameters, and accelerating the convergence speed of the loss rate. The convergence speed of GoogLeNet model loss rate was slightly lower than that of PWoodIDNet. Slight oscillation occurred during the training process, and the overall curve presented a downward trend. With the increase of iteration times, the curve gradually tended to converge.
The convergence speed of VGG16 and AlexNet model was relatively slow, and the curve kept oscillating. When the number of iterations reached 1000, the loss value of the model changed gently and gradually converged. Although the initial loss value of LeNet-5 model was low, which was approximately 3, the convergence rate of LeNet-5 model was noticeably lower than that of other convolutional neural network models.

Fig. 5. Validation loss rate curve of network model
Classification Results
Based on the same number of iterations, the parameters obtained from the verification set of the five networks model are shown in Table 3. The average classification accuracy of PWoodIDNet was the highest, reaching 99.41%. Its convergence speed and model classification accuracy were noticeably higher than those of the other two models, demonstrating the effectiveness of the network model. The recognition rate of GoogLeNet was second, which was more than 99%. However, GoogLeNet had a large number of convolution kernels, which led to a long training time of the model, and it was the model with the longest training time among the five models, which affects the detection efficiency. The accuracy of VGG16 was also high, reaching approximately 98%, but the training time of the model was still long, because VGG16 has three full connection layers, among which the first full connection layer has the most parameters, consumes more computing resources, and uses more parameters, which leads to more memory occupation and makes the training time longer. AlexNet had lower accuracy than PWoodIDNet, GoogLeNet, and VGG16, but the training time was shorter due to fewer network layers. The accuracy of LeNet-5 was the lowest among the five models, only approximately 70%, and the average loss rate was also high. The classification results of LeNet-5 models did not achieve the expected results.

By processing the convolution layer and pooling layer of the model, the main feature information was enhanced and the classification accuracy was improved. Except for LeNet-5, the microscopic image classification results of several models were all above 95%, as shown in Table 4.

Comparing the five convolutional neural network models, Quercus sp. and Spirostachys africana were the best. This reflects the great difference in the microstructure of broad-leaved timber, and the high-resolution microscopic CT can enlarge the wood to the micron level or even reach the nanometer level to observe the internal microstructure of wood, and the wood microstructure was clearly visible, so that the classification effect of wood can be greatly improved.
CONCLUSIONS
Aiming at the identification of precious tree species, a precious wood identification algorithm based on the PWoodIDNet model was proposed. The model extracts the classification features by deep self-learning, avoids the influence of artificial subjective extraction of classification features on image recognition results, and has the advantages of high classification accuracy, fast operation speed, and low misjudgment rate.
- In this paper, 16 wood species were scanned by high-resolution microscopic computed tomography (CT), and the microstructure characteristics, such as parenchyma, axial tubule, intercellular channel and vessel, were clearly visible. The PWoodIDNet model was used for automatic classification and identification. The results showed that the convolution operation of PWoodIDNet model can extract the edge contour information of the sample image through the low-level convolution layer, and has the ability to enhance the feature information and filter the noise. High level convolution layer can extract more advanced, complex, and abstract features, and feature information has a higher level of meaning.
- The model and detection method proposed in this paper will provide advanced identification methods and instruments for customs, import and export quarantine inspection, and other legal departments. In the later stage of research, more wood species should be added and more samples of wood species should be obtained to achieve the expected purpose. This is needed to improve the performance of identification technology for wood import and export quarantine inspection. Thus, the technology progress of wood import and export industry and wood processing and manufacturing enterprises will be promoted.
ACKNOWLEDGMENTS
The authors are grateful for the support of the youth fund of Shandong Natural Science Foundation, Grant No. ZR2020QC174, the Doctoral Foundation of Shandong Jianzhu University, Grant No. XNBS1622, and the Taishan Scholar Advantage Characteristic Discipline Talent Team Project of Shandong Province of China, Grant No. 2015162.
REFERENCES CITED
Chen, L., Papandreou, G., Kokkinos, I., Murphy, K., and Yuille, A. L. (2017). “DeepLab: Semantic image segmentation with deep convolutional nets, atrous convolution, and fully connected CRFs,” IEEE Transactions on Pattern Analysis & Machine Intelligence 40(4), 834-848. DOI: 10.1109/TPAMI.2017.2699184
Chen, L. C., Papandreou, G., Kokkinos, I., Murphy, K., and Yuille, A. L. (2017). “DeepLab: Semantic image segmentation with deep convolutional nets, atrous convolution, and fully connected CRFs,” IEEE Transactions on Pattern Analysis and Machine Intelligence 40(4), 834-848. DOI: 10.1109/TPAMI.2017.2699184
Fei, B. H., Zhao, Y., Qin, D. C., Y, Z., Hou, Z. Q., and Zhao, R. J. (2007). “Applying computerized tomography (CT) to study the feature of wood fracture,” Scientia Silvae Sinicae 43(4), 137-140. DOI: 10.3321/j.issn:1001-7488.2007.04.025
Ge, Z. D., Chen, L. X., Luo, R., Wang, Y. W., and Zhou, Y. C. (2018). “The detection of structure in wood by X-ray CT imaging technique,” BioResources 13(2), 3674-3685. DOI: 10.15376/biores.13.2.3674-3685
Ge, Z. D., Hou, X. P., Lu, S. Y., Qi, Y. H., Zhang, G. L., and Zhou, Y. C. (2016). “Wood CT detection system based on fast algorithm of inverse projection coordinate,” Transactions of the Chinese Society for Agricultural Machinery 47(3), 335-341. DOI: 10.6041/j.issn.1000-1298.2016.03.047
Gu, J. X., Wang, Z. H., Kuen, J., and Ma, L. (2018). “Recent advances in convolutional neural networks,” Pattern Recognition 77, 354-377. DOI: 10.1016/j.patcog.2017.10.013
Huang, Q. L., and Wang, Q. (2019). “Facial expression recognition based on cross-connect feature fusion network,” Computer Engineering and Design 40(10), 2969-2973. DOI: 10.16208/j.issn1000-7024.2019.10.040
Kiranyaz, S., Ince, T., and Gabbouj, M. (2016). “Real-time patient-specific ECG classification by 1-D convolutional neural networks,” IEEE Transactions on Biomedical Engineering 63(3), 664-675. DOI: 10.1109/TBME.2015.2468589
Krizhevsky, A., Sutskever, I., and Hinton, G. E. (2012). “ImageNet classification with deep convolutional neural networks,” International Conference on Neural Information Processing Systems 25(2), 1097-1105. DOI: 10.1145/3065386
Lécun, Y., Boser, B., Denker, J., and Henderson, D. (1989). “Backpropagation applied to handwritten zip code recognition,” Neural Computation 1(4), 541-551. DOI: 10.1162/neco.1989.1.4.541
Lécun, Y., Bottou, L., Bengio, Y., and Haffner, P. (1998). “Gradient-based learning applied to document recognition,” Proceedings of the IEEE 86(11), 2278-2324. DOI: 10.1109/5.726791
Ravindran, P., and Wiedenhoeft, A. C. (2020). “Comparison of two forensic wood identification technologies for ten Meliaceae woods: Computer vision versus mass spectrometry,” Wood Science and Technology 54(5), 1139-1150. DOI: 10.1007/s00226-020-01178-1
Rumelhart, E. D., Hinton, E. G., and Williams, J. R. (1986). “Learning representations by back propagating errors,” Nature 323(6088), 533-536. DOI: 10.1038/323533a0
Szegedy, C., Liu, W., Jia, Y. Q., Sermanet, P., Reed, S., Anguelov, D., Erhan, D., Vanhoucke, V., and Rabinovich, A. (2015). “Going deeper with convolutions,” Proceedings of the IEEE Conference on Computer Vision and Pattern Recognition, Boston, MA, USA, pp. 1-9. DOI: 10.1109/CVPR.2015.7298594
Vishal, S., Jyoti, Y., Raj, K., Daniela, T., Adam, E., and Pawan, K. M. (2020). “On the rapid and non-destructive approach for wood identification using ATR-FTIR spectroscopy and chemometric methods,” Vibrational Spectroscopy 110, 1-36. DOI: 10.1016/j.vibspec.2020.103097
Wang, Y., She, S., Zhou, N., Zhou, J., Yan, H., and Li, W. (2019). “Wood species identification using Terahertz time-domain spectroscopy,” BioResources 14(1), 1033-1048. DOI: 10.15376/biores.14.1.1033-1048
Zhang, M., Smith, B. G., McArdle, B. H., Chavan, R. R., James, B. J., and Harris, P. J. (2018). “Dimensional changes of tracheids during drying of radiata pine (Pinus radiata D. Don) compression woods: A study using variable-pressure scanning electron microscopy (VP-SEM),” Plants 7(1), 14-33. DOI: 10.3390/plants7010014
Zhu, J., and Wang, H. (2014). “Feature extraction method of wood SEM micrographs based on graph cuts,” Scientia Silvae Sinicae 50(4), 111-117. DOI: 10.11707/j.1001-7488.20140416
Article submitted: January 18, 2021; Peer review completed: May 8, 2021; Revised version received and accepted: May 15, 2021; Published: May 24, 2021.
DOI: 10.15376/biores.16.3.4986-4999